Dell 2010 Annual Report Download - page 40
Download and view the complete annual report
Please find page 40 of the 2010 Dell annual report below. You can navigate through the pages in the report by either clicking on the pages listed below, or by using the keyword search tool below to find specific information within the annual report.-
 1
1 -
2
-
3
-
4
-
5
-
6
-
7
-
8
-
9
-
10
-
11
-
12
-
13
-
14
-
15
-
16
-
17
-
18
-
19
-
20
-
21
-
22
-
23
-
24
-
25
-
26
-
27
-
28
-
29
-
 30
30 -
 31
31 -
 32
32 -
 33
33 -
 34
34 -
 35
35 -
 36
36 -
 37
37 -
 38
38 -
 39
39 -
 40
40 -
 41
41 -
 42
42 -
 43
43 -
 44
44 -
 45
45 -
 46
46 -
 47
47 -
 48
48 -
 49
49 -
 50
50 -
51
-
52
-
53
-
54
-
55
-
56
-
57
-
58
-
59
-
60
-
61
-
62
-
63
-
64
-
65
-
66
-
67
-
68
-
69
-
70
-
71
-
72
-
73
-
74
-
75
-
76
-
77
-
78
-
79
-
80
-
81
-
82
-
83
-
84
-
85
-
86
-
87
-
88
-
89
-
90
-
91
-
92
-
93
-
94
-
95
-
96
-
97
-
98
-
99
-
100
-
101
-
102
-
103
-
104
-
105
-
106
-
107
-
108
-
109
-
110
-
111
-
112
-
113
-
114
-
115
-
116
-
117
-
118
-
119
-
120
-
121
-
122
-
123
-
124
-
125
-
126
-
127
-
128
-
129
-
130
-
131
-
132
-
133
-
134
-
135
-
136
-
137
-
138
-
139
-
140
-
141
-
142
-
143
-
144
-
145
-
146
-
147
-
148
-
149
-
150
-
151
-
152
-
153
-
154
 |
 |

Table of Contents
participation in certain lower priced but higher demand bands in an effort to protect profitability. Storage and services had 9% and
8% year-over-year decreases, respectively. Consistent with our other Commercial segments' performance, the contraction of the
global economy during the first half of Fiscal 2010 and competitive pressures were significant contributors to SMB's year-over-year
revenue declines. From a country perspective, SMB had year-over-year revenue declines in most countries except the BRIC
countries, in which the combined revenue grew 24%.
Operating income percentage increased 10 basis points year-over-year to 8.6% during Fiscal 2010. Operating income dollars
decreased 18% as revenue and unit shipments decreased significantly for both periods. Also impacting operating income was a slight
increase in gross margin percentage during Fiscal 2010. We were also able to reduce operating expenses during Fiscal 2010, mainly
due to tighter spending controls on SG&A and RD&E expenses.
• Consumer — During Fiscal 2010, Consumer's revenue declined 6% year-over-year, on unit growth of 19%. Even though unit
shipments grew, our Consumer revenue decreased mainly due to the effects of our growth in retail, which tends to have lower
average selling prices, combined with a shift in product mix and competitive pricing pressures. As a result, our average selling prices
declined 21% year-over-year during Fiscal 2010. From a product perspective, Consumer's desktop PC revenue declined 24% during
Fiscal 2010 as compared to Fiscal 2009 on a unit shipment decline of 10%. Mobility revenue increased 4% during Fiscal 2010.
During the same period, mobility units shipped increased year-over-year by 32%; however, the positive impact of increased
shipments was offset by an average selling price per unit decline of 21%. The continued shift in consumer preference from desktops
to notebooks has contributed to our mobility unit growth. The reduction in mobility average selling prices was mainly attributable to
our expansion into retail coupled with a demand shift from higher to lower priced notebooks and the growing popularity of netbooks.
Software and peripherals and services revenue also declined 12% and 16% year-over-year, respectively, during Fiscal 2010. At a
country level, our targeted BRIC revenue grew 46% during Fiscal 2010.
Consumer's operating income percentage declined approximately 150 basis points year-over-year to 0.9%. Consumer's operating
performance was affected by a year-over-year decline in gross margin during Fiscal 2010 mainly due to the previously mentioned
revenue declines and to component cost pressures. Even though operating expenses decreased year-over-year, operating expenses as
a percentage of revenue remained relatively flat during Fiscal 2010 as compared to Fiscal 2009.
During Fiscal 2010, Consumer's revenue and operating income was favorably impacted by a second quarter $53 million transaction,
in which a vendor purchased our contractual right to share in future revenues from product renewals sold by the vendor. Excluding
this transaction, Consumer's Fiscal 2010 operating income percentage would have been 0.4% instead of 0.9%.
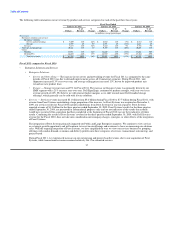
Revenue by Product and Services Categories
We design, develop, manufacture, market, sell, and support a wide range of products that in many cases are customized to individual
customer requirements. Our products are organized between enterprise and client categories. Our enterprise products include servers and
networking, and storage products. Client products include mobility and desktop PC products. Our services include a broad range of
configurable IT and business services, including infrastructure technology, consulting and applications, and product-related support
services. We also offer software and peripheral products.
36