Dell 2010 Annual Report Download - page 33
Download and view the complete annual report
Please find page 33 of the 2010 Dell annual report below. You can navigate through the pages in the report by either clicking on the pages listed below, or by using the keyword search tool below to find specific information within the annual report.-
 1
1 -
2
-
3
-
4
-
5
-
6
-
7
-
8
-
9
-
10
-
11
-
12
-
13
-
14
-
15
-
16
-
17
-
18
-
19
-
20
-
21
-
22
-
 23
23 -
 24
24 -
 25
25 -
 26
26 -
 27
27 -
 28
28 -
 29
29 -
 30
30 -
 31
31 -
 32
32 -
 33
33 -
 34
34 -
 35
35 -
 36
36 -
 37
37 -
 38
38 -
 39
39 -
 40
40 -
 41
41 -
 42
42 -
 43
43 -
44
-
45
-
46
-
47
-
48
-
49
-
50
-
51
-
52
-
53
-
54
-
55
-
56
-
57
-
58
-
59
-
60
-
61
-
62
-
63
-
64
-
65
-
66
-
67
-
68
-
69
-
70
-
71
-
72
-
73
-
74
-
75
-
76
-
77
-
78
-
79
-
80
-
81
-
82
-
83
-
84
-
85
-
86
-
87
-
88
-
89
-
90
-
91
-
92
-
93
-
94
-
95
-
96
-
97
-
98
-
99
-
100
-
101
-
102
-
103
-
104
-
105
-
106
-
107
-
108
-
109
-
110
-
111
-
112
-
113
-
114
-
115
-
116
-
117
-
118
-
119
-
120
-
121
-
122
-
123
-
124
-
125
-
126
-
127
-
128
-
129
-
130
-
131
-
132
-
133
-
134
-
135
-
136
-
137
-
138
-
139
-
140
-
141
-
142
-
143
-
144
-
145
-
146
-
147
-
148
-
149
-
150
-
151
-
152
-
153
-
154
 |
 |

Table of Contents
Operating and Net Income
Fiscal 2011 compared to Fiscal 2010
• Operating Income — During Fiscal 2011, operating income increased 58% to $3.4 billion on a GAAP basis and 40% to $4.1 billion
on a non-GAAP basis from Fiscal 2010. The increases were primarily attributable to increased revenue, improved gross margins, and
better operating leverage resulting from the increase in net revenue. For Fiscal 2011, operating expenses increased 12% on a GAAP
basis and 14% on a non-GAAP basis, while operating expenses as a percentage of revenue decreased slightly.
• Net Income — During Fiscal 2011, net income increased 84% to $2.6 billion on a GAAP basis and 51% to $3.1 billion on a non-
GAAP basis from Fiscal 2010. Net income was positively impacted by increases in operating income and a lower effective income
tax rate. In addition, on a GAAP basis, Interest and Other, net increased favorably by 44% for Fiscal 2011 due primarily to a
$72 million merger termination fee we received during the third quarter of Fiscal 2011. See "Income and Other Taxes" and "Interest
and Other, net" below for discussion of our effective tax rates and interest and other, net.
Fiscal 2010 compared to Fiscal 2009
• Operating Income — During Fiscal 2010, operating income decreased 32% to $2.2 billion on a GAAP basis and 19% to $3.0 billion
on a non-GAAP basis from Fiscal 2009. The decreases in operating income were primarily attributable to a year-over-year revenue
decline of 13% and a year-over-year decline in gross margin dollars on both a GAAP and non-GAAP basis. A year-over-year
reduction in operating expenses on a GAAP and non-GAAP basis during Fiscal 2010 favorably impacted operating income, while
operating expenses as a percentage of revenue increased slightly during the same periods.
• Net Income — Net income for Fiscal 2010 decreased by 42% to $1.4 billion on a GAAP basis and 28% to $2.1 billion on a non-
GAAP basis from Fiscal 2009. Net income was impacted by significant declines in operating income and an unfavorable change in
interest and other, net in Fiscal 2010 compared to Fiscal 2009. During Fiscal 2010 as compared to Fiscal 2009, our net income on a
GAAP basis was negatively impacted by an increase in our effective income tax rate to 29.2% from 25.4%. See "Income and Other
Taxes" and "Interest and Other, net" below for discussion of our effective tax rates and interest and other, net.
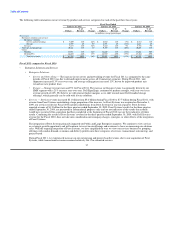
Non-GAAP Financial Measures
We use non-GAAP financial measures in this Report as performance measures to supplement the financial information we present on a
GAAP basis. We believe that excluding certain items from our GAAP results allows our management and investors to better understand
our consolidated financial performance from period to period and in relationship to the operating results of our segments, as our
management does not believe that the excluded items are reflective of our underlying operating performance. We also believe that
excluding certain items from our GAAP results allows our management to better project our future consolidated financial performance
because our forecasts are developed at a level of detail different from that used to prepare GAAP-based financial measures. Moreover, we
believe the non-GAAP financial measures provide investors with useful information to help them evaluate our operating results by
facilitating an enhanced understanding of our underlying operating performance and enabling them to make more meaningful period to
period comparisons.
The non-GAAP financial measures presented in this Report include non-GAAP gross margin, non-GAAP operating expenses, non-
GAAP operating income, non-GAAP net income and non-GAAP earnings per share. These non-GAAP financial measures, as defined by
us, represent the comparable GAAP financial measures adjusted to exclude primarily the following items: acquisition-related charges;
amortization of purchased intangible assets related to acquisitions; severance and facility action costs; accelerated stock option expenses
that were incurred in Fiscal 2009, a merger termination fee that was received during the third quarter of Fiscal 2011; and amounts for the
settlement of the SEC investigation, as well as the settlement of a securities litigation matter, which were incurred during the first quarter
of Fiscal 2011. We provide below more detail regarding each of these items and our reasons for excluding the items. In future periods, we
expect that we may again exclude such items and may incur income and expenses similar to these excluded items. Accordingly, the
exclusion of these items and other similar items in our non-GAAP presentation should not be interpreted as implying that the items are
non-recurring, infrequent, or unusual.
29