Ford 2014 Annual Report Download - page 9
Download and view the complete annual report
Please find page 9 of the 2014 Ford annual report below. You can navigate through the pages in the report by either clicking on the pages listed below, or by using the keyword search tool below to find specific information within the annual report.-
 1
1 -
 2
2 -
 3
3 -
 4
4 -
 5
5 -
 6
6 -
 7
7 -
 8
8 -
 9
9 -
 10
10 -
 11
11 -
 12
12 -
 13
13 -
 14
14 -
 15
15 -
 16
16 -
 17
17 -
 18
18 -
 19
19 -
 20
20 -
21
-
22
-
23
-
24
-
25
-
26
-
27
-
28
-
29
-
30
-
31
-
32
-
33
-
34
-
35
-
36
-
37
-
38
-
39
-
40
-
41
-
42
-
43
-
44
-
45
-
46
-
47
-
48
-
49
-
50
-
51
-
52
-
53
-
54
-
55
-
56
-
57
-
58
-
59
-
60
-
61
-
62
-
63
-
64
-
65
-
66
-
67
-
68
-
69
-
70
-
71
-
72
-
73
-
74
-
75
-
76
-
77
-
78
-
79
-
80
-
81
-
82
-
83
-
84
-
85
-
86
-
87
-
88
-
89
-
90
-
91
-
92
-
93
-
94
-
95
-
96
-
97
-
98
-
99
-
100
-
101
-
102
-
103
-
104
-
105
-
106
-
107
-
108
-
109
-
110
-
111
-
112
-
113
-
114
-
115
-
116
-
117
-
118
-
119
-
120
-
121
-
122
-
123
-
124
-
125
-
126
-
127
-
128
-
129
-
130
-
131
-
132
-
133
-
134
-
135
-
136
-
137
-
138
-
139
-
140
-
141
-
142
-
143
-
144
-
145
-
146
-
147
-
148
-
149
-
150
-
151
-
152
-
153
-
154
-
155
-
156
-
157
-
158
-
159
-
160
-
161
-
162
-
163
-
164
-
165
-
166
-
167
-
168
-
169
-
170
-
171
-
172
-
173
-
174
-
175
-
176
-
177
-
178
-
179
-
180
-
181
-
182
-
183
-
184
-
185
-
186
-
187
-
188
-
189
-
190
-
191
-
192
-
193
-
194
-
195
-
196
-
197
-
198
-
199
-
200
 |
 |

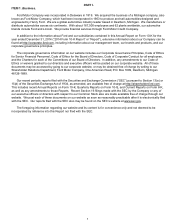
Item 1. Business (Continued)
geopolitical events, and other factors (including the cost of purchasing and operating cars and trucks and the availability
and cost of financing and fuel). As we recently have seen in the United States and Europe, in particular, the number of
cars and trucks sold may vary substantially from year to year. Further, the automotive industry is a highly competitive
business that has a wide and growing variety of product offerings from a growing number of manufacturers.
Our wholesale unit volumes vary with the level of total industry demand and our share of that industry demand. Our
wholesale unit volumes also are influenced by the level of dealer inventory. Our share is influenced by how our products
are perceived in comparison to those offered by other manufacturers based on many factors, including price, quality,
styling, reliability, safety, fuel efficiency, functionality, and reputation. Our share also is affected by the timing and
frequency of new model introductions. Our ability to satisfy changing consumer preferences with respect to type or size of
vehicle, as well as design and performance characteristics, affects our sales and earnings significantly.
As with other manufacturers, the profitability of our business is affected by many factors, including:
• Wholesale unit volumes
• Margin of profit on each vehicle sold - which in turn is affected by many factors, such as:
Market factors - volume and mix of vehicles and options sold, and net pricing (reflecting, among other factors,
incentive programs)
Costs of components and raw materials necessary for production of vehicles
Costs for customer warranty claims and additional service actions
Costs for safety, emissions, and fuel economy technology and equipment
• A high proportion of relatively fixed structural costs, so that small changes in wholesale unit volumes can
significantly affect overall profitability
Our industry has a very competitive pricing environment, driven in part by industry excess capacity, which is
concentrated in Europe and Asia but affects other markets because much of this capacity can be redirected to other
markets. The decline in the value of the yen during the past three years also has contributed significantly to competitive
pressures in many of our markets. For the past several decades, manufacturers typically have given price discounts and
other marketing incentives to maintain market share and production levels. A discussion of our strategies to compete in
this pricing environment is set forth in the “Overview” section in Item 7.
Competitive Position. The worldwide automotive industry consists of many producers, with no single dominant
producer. Certain manufacturers, however, account for the major percentage of total sales within particular countries,
especially their countries of origin. Key competitors with global presence include Fiat Chrysler Automobiles, General
Motors Company, Honda Motor Company, Hyundai-Kia Automotive Group, PSA Peugeot Citroen, Renault-Nissan B.V.,
Suzuki Motor Corporation, Toyota Motor Corporation, and Volkswagen AG Group.
Seasonality. We generally record the sale of a vehicle (and recognize revenue) when it is produced and shipped or
delivered to our customer (i.e., the dealership). See the “Overview” section in Item 7 for additional discussion of revenue
recognition practices.
We manage our vehicle production schedule based on a number of factors, including retail sales (i.e., units sold by
our dealerships to their customers at retail) and dealer stock levels (i.e., the number of units held in inventory by our
dealerships for sale to their customers). Historically, we have experienced some seasonal fluctuation in the business, with
production in many markets tending to be higher in the first half of the year to meet demand in the spring and summer
(typically the strongest sales months of the year).
Raw Materials. We purchase a wide variety of raw materials from numerous suppliers around the world for use in
production of our vehicles. These materials include base metals (e.g., steel, iron castings, and aluminum), precious
metals (e.g., palladium), energy (e.g., natural gas), and plastics/resins (e.g., polypropylene). We believe we have
adequate supplies or sources of availability of raw materials necessary to meet our needs. There always are risks and
uncertainties with respect to the supply of raw materials, however, which could impact availability in sufficient quantities to
meet our needs. See the “Overview” section of Item 7 for a discussion of commodity and energy price trends, and
“Item 7A. Quantitative and Qualitative Disclosures about Market Risk” (“Item 7A”) for a discussion of commodity price
risks.
Backlog Orders. We generally produce and ship our products on average within approximately 20 days after an order
is deemed to become firm. Therefore, no significant amount of backlog orders accumulates during any period.
3