General Motors 2010 Annual Report Download - page 122
Download and view the complete annual report
Please find page 122 of the 2010 General Motors annual report below. You can navigate through the pages in the report by either clicking on the pages listed below, or by using the keyword search tool below to find specific information within the annual report.-
 1
1 -
2
-
3
-
4
-
5
-
6
-
7
-
8
-
9
-
10
-
11
-
12
-
13
-
14
-
15
-
16
-
17
-
18
-
19
-
20
-
21
-
22
-
23
-
24
-
25
-
26
-
27
-
28
-
29
-
30
-
31
-
32
-
33
-
34
-
35
-
36
-
37
-
38
-
39
-
40
-
41
-
42
-
43
-
44
-
45
-
46
-
47
-
48
-
49
-
50
-
51
-
52
-
53
-
54
-
55
-
56
-
57
-
58
-
59
-
60
-
61
-
62
-
63
-
64
-
65
-
66
-
67
-
68
-
69
-
70
-
71
-
72
-
73
-
74
-
75
-
76
-
77
-
78
-
79
-
80
-
81
-
82
-
83
-
84
-
85
-
86
-
87
-
88
-
89
-
90
-
91
-
92
-
93
-
94
-
95
-
96
-
97
-
98
-
99
-
100
-
101
-
102
-
103
-
104
-
105
-
106
-
107
-
108
-
109
-
110
-
111
-
 112
112 -
 113
113 -
 114
114 -
 115
115 -
 116
116 -
 117
117 -
 118
118 -
 119
119 -
 120
120 -
 121
121 -
 122
122 -
 123
123 -
 124
124 -
 125
125 -
 126
126 -
 127
127 -
 128
128 -
 129
129 -
 130
130 -
 131
131 -
 132
132 -
133
-
134
-
135
-
136
-
137
-
138
-
139
-
140
-
141
-
142
-
143
-
144
-
145
-
146
-
147
-
148
-
149
-
150
-
151
-
152
-
153
-
154
-
155
-
156
-
157
-
158
-
159
-
160
-
161
-
162
-
163
-
164
-
165
-
166
-
167
-
168
-
169
-
170
-
171
-
172
-
173
-
174
-
175
-
176
-
177
-
178
-
179
-
180
-
181
-
182
-
183
-
184
-
185
-
186
-
187
-
188
-
189
-
190
-
191
-
192
-
193
-
194
-
195
-
196
-
197
-
198
-
199
-
200
-
201
-
202
-
203
-
204
-
205
-
206
-
207
-
208
-
209
-
210
-
211
-
212
-
213
-
214
-
215
-
216
-
217
-
218
-
219
-
220
-
221
-
222
-
223
-
224
-
225
-
226
-
227
-
228
-
229
-
230
-
231
-
232
-
233
-
234
-
235
-
236
-
237
-
238
-
239
-
240
-
241
-
242
-
243
-
244
-
245
-
246
-
247
-
248
-
249
-
250
-
251
-
252
-
253
-
254
-
255
-
256
-
257
-
258
-
259
-
260
-
261
-
262
-
263
-
264
-
265
-
266
-
267
-
268
-
269
-
270
-
271
-
272
-
273
-
274
-
275
-
276
-
277
-
278
-
279
-
280
-
281
-
282
-
283
-
284
-
285
-
286
-
287
-
288
-
289
-
290
 |
 |

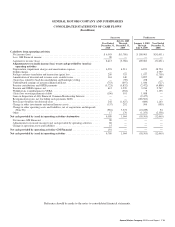
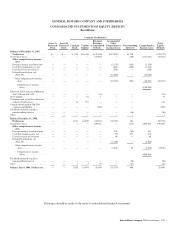
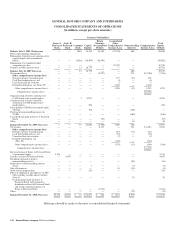
GENERAL MOTORS COMPANY AND SUBSIDIARIES
CONSOLIDATED STATEMENTS OF CASH FLOWS — (Continued)
(In millions)
Successor Predecessor
Year Ended
December 31,
2010
July 10, 2009
Through
December 31,
2009
January 1, 2009
Through
July 9, 2009
Year Ended
December 31,
2008
Cash flows from investing activities
Expenditures for property .............................................. (4,200) (1,862) (3,517) (7,530)
Available-for-sale marketable securities, acquisitions ........................ (11,012) — (202) (3,771)
Trading marketable securities, acquisitions ................................ (358) (158) — —
Available-for-sale marketable securities, liquidations ........................ 5,611 3 185 5,866
Trading marketable securities, liquidations ................................. 343 168 — —
Acquisition of companies, net of cash acquired other than cash acquired with GM
Financial ......................................................... (3,580) (2,127) — (1)
Increase due to consolidation of business units .............................. 63 222 46 —
Distributions from (investments in) Ally Financial .......................... — 72 (884) —
Operating leases, liquidations ........................................... 346 564 1,307 3,610
Proceeds from sale of business units/equity investments, net ................... 317 — — 232
Proceeds from sale of real estate, plants and equipment ....................... 188 67 38 347
Change in notes receivable ............................................. 46 61 (23) (430)
Increase in restricted cash and marketable securities ......................... (871) (3,604) (18,461) (87)
Decrease in restricted cash and marketable securities ......................... 13,823 8,775 418 —
Other investing activities ............................................... 2 (25) (41) —
Net cash provided by (used in) investing activities–Automotive ................ 718 2,156 (21,134) (1,764)
GM Financial cash on hand at acquisition ................................. 538 — — —
Purchase of receivables ................................................ (947) — — —
Principal collections and recoveries on receivables .......................... 871 — — —
Other investing activities ............................................... 53 — — —
Net cash provided by (used in) investing activities–GM Financial .............. 515 — — —
Net cash provided by (used in) investing activities ........................... 1,233 2,156 (21,134) (1,764)
Cash flows from financing activities
Net decrease in short-term debt .......................................... (1,097) (352) (2,364) (4,100)
Proceeds from issuance of debt (original maturities greater than three months) .... 718 6,153 53,949 9,928
Payments on debt (original maturities greater than three months) ............... (10,536) (5,259) (6,072) (1,702)
Proceeds from issuance of stock ......................................... 4,857 — — —
Payments to purchase stock ............................................. (1,462) — — —
Cash, cash equivalents and restricted cash retained by MLC ................... — — (1,216) —
Payments to acquire noncontrolling interest ................................ (6) (100) (5) —
Debt issuance costs and fees paid for debt modification ....................... (161) — (63) —
Cash dividends paid (including premium paid on redemption of stock) .......... (1,572) (97) — (283)
Net cash provided by (used in) financing activities–Automotive ............... (9,259) 345 44,229 3,843
Net change in credit facilities ........................................... 212 — — —
Issuance of debt ...................................................... 700 — — —
Payments of debt ..................................................... (1,419) — — —
Other financing activities .............................................. (4) — — —
Net cash provided by (used in) financing activities–GM Financial ............. (511) — — —
Net cash provided by (used in) financing activities .......................... (9,770) 345 44,229 3,843
Effect of exchange rate changes on cash and cash equivalents–Automotive ....... (57) 492 168 (778)
Net increase (decrease) in cash and cash equivalents–Automotive .............. (2,009) 4,057 4,960 (10,764)
Net increase (decrease) in cash and cash equivalents–GM Financial ............. 195 — — —
Cash and cash equivalents reclassified as assets held for sale–Automotive ........ 391 (391) — —
Cash and cash equivalents at beginning of period–Automotive .............. 22,679 19,013 14,053 24,817
Cash and cash equivalents at end of period–Automotive ................... $21,061 $22,679 $ 19,013 $ 14,053
Cash and cash equivalents at end of period–GM Financial ................. $ 195 $ — $ — $ —
Reference should be made to the notes to consolidated financial statements.
120 General Motors Company 2010 Annual Report