General Motors 2010 Annual Report Download - page 65
Download and view the complete annual report
Please find page 65 of the 2010 General Motors annual report below. You can navigate through the pages in the report by either clicking on the pages listed below, or by using the keyword search tool below to find specific information within the annual report.-
 1
1 -
2
-
3
-
4
-
5
-
6
-
7
-
8
-
9
-
10
-
11
-
12
-
13
-
14
-
15
-
16
-
17
-
18
-
19
-
20
-
21
-
22
-
23
-
24
-
25
-
26
-
27
-
28
-
29
-
30
-
31
-
32
-
33
-
34
-
35
-
36
-
37
-
38
-
39
-
40
-
41
-
42
-
43
-
44
-
45
-
46
-
47
-
48
-
49
-
50
-
51
-
52
-
53
-
54
-
 55
55 -
 56
56 -
 57
57 -
 58
58 -
 59
59 -
 60
60 -
 61
61 -
 62
62 -
 63
63 -
 64
64 -
 65
65 -
 66
66 -
 67
67 -
 68
68 -
 69
69 -
 70
70 -
 71
71 -
 72
72 -
 73
73 -
 74
74 -
 75
75 -
76
-
77
-
78
-
79
-
80
-
81
-
82
-
83
-
84
-
85
-
86
-
87
-
88
-
89
-
90
-
91
-
92
-
93
-
94
-
95
-
96
-
97
-
98
-
99
-
100
-
101
-
102
-
103
-
104
-
105
-
106
-
107
-
108
-
109
-
110
-
111
-
112
-
113
-
114
-
115
-
116
-
117
-
118
-
119
-
120
-
121
-
122
-
123
-
124
-
125
-
126
-
127
-
128
-
129
-
130
-
131
-
132
-
133
-
134
-
135
-
136
-
137
-
138
-
139
-
140
-
141
-
142
-
143
-
144
-
145
-
146
-
147
-
148
-
149
-
150
-
151
-
152
-
153
-
154
-
155
-
156
-
157
-
158
-
159
-
160
-
161
-
162
-
163
-
164
-
165
-
166
-
167
-
168
-
169
-
170
-
171
-
172
-
173
-
174
-
175
-
176
-
177
-
178
-
179
-
180
-
181
-
182
-
183
-
184
-
185
-
186
-
187
-
188
-
189
-
190
-
191
-
192
-
193
-
194
-
195
-
196
-
197
-
198
-
199
-
200
-
201
-
202
-
203
-
204
-
205
-
206
-
207
-
208
-
209
-
210
-
211
-
212
-
213
-
214
-
215
-
216
-
217
-
218
-
219
-
220
-
221
-
222
-
223
-
224
-
225
-
226
-
227
-
228
-
229
-
230
-
231
-
232
-
233
-
234
-
235
-
236
-
237
-
238
-
239
-
240
-
241
-
242
-
243
-
244
-
245
-
246
-
247
-
248
-
249
-
250
-
251
-
252
-
253
-
254
-
255
-
256
-
257
-
258
-
259
-
260
-
261
-
262
-
263
-
264
-
265
-
266
-
267
-
268
-
269
-
270
-
271
-
272
-
273
-
274
-
275
-
276
-
277
-
278
-
279
-
280
-
281
-
282
-
283
-
284
-
285
-
286
-
287
-
288
-
289
-
290
 |
 |

GENERAL MOTORS COMPANY AND SUBSIDIARIES
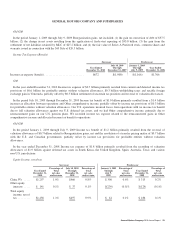
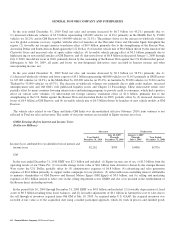
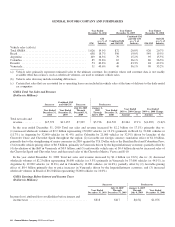
In the year ended December 31, 2010 Total net sales and revenue increased by $45 million (or 0.2%) primarily due to: (1) increased
wholesale volumes of $0.5 billion representing 38,000 vehicles (or 3.1%) primarily due to 31,000 Buick Regals exported to the U.S.,
and increases in Turkey by 17,000 vehicles (or 68.9%), in Russia by 14,000 vehicles (or 48.9%), in the United Kingdom by 13,000
vehicles (or 5.0%), in the Netherlands by 12,000 vehicles (or 37.8%), in Portugal by 11,000 vehicles (or 103.0%), in Italy by 11,000
(or 9.0%), partially offset by a decrease in Germany of 113,000 vehicles (or 33.0%) driven by the end of the government subsidies
program. The net wholesale volume increase was offset by a decrease in wholesale volumes throughout the region of $0.5 billion
representing 17,000 vehicles due to the sale of Saab in February 2010; (2) favorable vehicle mix of $0.5 billion primarily due to the
Opel Insignia and increased sales of other higher priced vehicles; (3) favorable vehicle pricing effect of $0.5 billion driven by
launches of the Opel Astra and Opel Meriva; partially offset by (4) unfavorable net foreign currency translation effect of $0.7 billion,
primarily due to the weakening of the Euro and British Pound against the U.S. Dollar; and (5) lower volumes of rental car activity and
subsequent repurchases sold at auction of $0.2 billion.
In the year ended December 31, 2009 Total net sales and revenue decreased by $10.6 billion (or 30.6%) primarily due to:
(1) decreased wholesale volumes of $4.8 billion representing 405,000 vehicles (or 24.8%) primarily due to decreases in the United
Kingdom by 99,000 vehicles (or 26.7%), in Russia by 69,000 vehicles (or 70.2%), in Italy by 25,000 vehicles (or 16.8%), and exports
to the U.S. by 33,000 vehicles (or 94.4%), partially offset by an increase in Germany by 65,000 vehicles (or 23.4%) driven by the
government subsidy program. The decrease in vehicle sales volumes was primarily due to tight credit markets, increased
unemployment rates, a recession in many international markets, Old GM’s well publicized liquidity issues and Chapter 11
Proceedings and the announcement that Old GM was seeking a majority investor in Adam Opel; (2) unfavorable net foreign currency
translation and transaction effect of $3.7 billion driven primarily by the strengthening of the U.S. Dollar against the Euro;
(3) decreased sales revenue at Saab of $1.2 billion; (4) decreased powertrain and parts and accessories revenue of $0.8 billion;
partially offset by (5) favorable vehicle pricing effect of $1.3 billion.
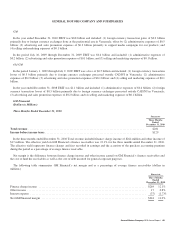
GME Loss Before Interest and Income Taxes
(Dollars in Millions)
Successor Predecessor
Year Ended
December 31, 2010
July 10, 2009
Through
December 31, 2009
January 1, 2009
Through
July 9, 2009
Year Ended
December 31, 2008
Loss attributable to stockholders before interest and income
taxes ........................................... $(1,764) $(814) $(2,815) $(2,625)
GM
In the year ended December 31, 2010 EBIT was a loss of $1.8 billion and included: (1) restructuring charges of $0.8 billion
primarily related to separation programs announced in Belgium, Spain, Germany and the United Kingdom; (2) advertising and sales
promotion expenses of $0.8 billion primarily related to support media campaigns for our products; (3) administrative expense of $0.6
billion; and (4) selling and marketing expenses of $0.5 billion related to our dealerships.
In the period July 10, 2009 through December 31, 2009 EBIT was a loss of $0.8 billion and included: (1) advertising and sales
promotion expenses of $0.4 billion primarily related to support media campaigns for our products; (2) administrative expense of $0.3
billion; (3) selling and marketing expenses of $0.3 billion related to our dealerships; partially offset by (4) favorable adjustments in
Automotive cost of sales of $0.5 billion due to the sell through of inventory acquired from Old GM at July 10, 2009. As required
under U.S. GAAP, the acquired inventory was recorded at fair value as of the acquisition date using a market participant approach,
which for work in process and finished goods inventory considered the estimated selling price of the inventory less the costs a market
participant would incur to complete, sell and dispose of the inventory, which may be different than our costs, and the profit margin
required for its completion and disposal effort.
General Motors Company 2010 Annual Report 63