General Motors 2010 Annual Report Download - page 281
Download and view the complete annual report
Please find page 281 of the 2010 General Motors annual report below. You can navigate through the pages in the report by either clicking on the pages listed below, or by using the keyword search tool below to find specific information within the annual report.-
 1
1 -
2
-
3
-
4
-
5
-
6
-
7
-
8
-
9
-
10
-
11
-
12
-
13
-
14
-
15
-
16
-
17
-
18
-
19
-
20
-
21
-
22
-
23
-
24
-
25
-
26
-
27
-
28
-
29
-
30
-
31
-
32
-
33
-
34
-
35
-
36
-
37
-
38
-
39
-
40
-
41
-
42
-
43
-
44
-
45
-
46
-
47
-
48
-
49
-
50
-
51
-
52
-
53
-
54
-
55
-
56
-
57
-
58
-
59
-
60
-
61
-
62
-
63
-
64
-
65
-
66
-
67
-
68
-
69
-
70
-
71
-
72
-
73
-
74
-
75
-
76
-
77
-
78
-
79
-
80
-
81
-
82
-
83
-
84
-
85
-
86
-
87
-
88
-
89
-
90
-
91
-
92
-
93
-
94
-
95
-
96
-
97
-
98
-
99
-
100
-
101
-
102
-
103
-
104
-
105
-
106
-
107
-
108
-
109
-
110
-
111
-
112
-
113
-
114
-
115
-
116
-
117
-
118
-
119
-
120
-
121
-
122
-
123
-
124
-
125
-
126
-
127
-
128
-
129
-
130
-
131
-
132
-
133
-
134
-
135
-
136
-
137
-
138
-
139
-
140
-
141
-
142
-
143
-
144
-
145
-
146
-
147
-
148
-
149
-
150
-
151
-
152
-
153
-
154
-
155
-
156
-
157
-
158
-
159
-
160
-
161
-
162
-
163
-
164
-
165
-
166
-
167
-
168
-
169
-
170
-
171
-
172
-
173
-
174
-
175
-
176
-
177
-
178
-
179
-
180
-
181
-
182
-
183
-
184
-
185
-
186
-
187
-
188
-
189
-
190
-
191
-
192
-
193
-
194
-
195
-
196
-
197
-
198
-
199
-
200
-
201
-
202
-
203
-
204
-
205
-
206
-
207
-
208
-
209
-
210
-
211
-
212
-
213
-
214
-
215
-
216
-
217
-
218
-
219
-
220
-
221
-
222
-
223
-
224
-
225
-
226
-
227
-
228
-
229
-
230
-
231
-
232
-
233
-
234
-
235
-
236
-
237
-
238
-
239
-
240
-
241
-
242
-
243
-
244
-
245
-
246
-
247
-
248
-
249
-
250
-
251
-
252
-
253
-
254
-
255
-
256
-
257
-
258
-
259
-
260
-
261
-
262
-
263
-
264
-
265
-
266
-
267
-
268
-
269
-
270
-
 271
271 -
 272
272 -
 273
273 -
 274
274 -
 275
275 -
 276
276 -
 277
277 -
 278
278 -
 279
279 -
 280
280 -
 281
281 -
 282
282 -
 283
283 -
 284
284 -
 285
285 -
 286
286 -
 287
287 -
 288
288 -
 289
289 -
 290
290
 |
 |

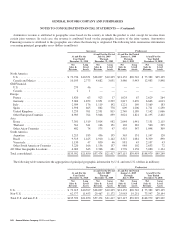
GENERAL MOTORS COMPANY AND SUBSIDIARIES
NOTES TO CONSOLIDATED FINANCIAL STATEMENTS — (Continued)
Successor
GMNA GME GMIO GMSA Corporate Eliminations
Total
Automotive
At and For the Period July 10, 2009 Through
December 31, 2009
Sales
External customers .......................... $31,454 $11,340 $ 7,221 $ 7,314 $ — $ — $ 57,329
Intersegment ............................... 972 139 1,346 81 — (2,538) —
Other revenue ..............................——— 4141 — 145
Total net sales and revenue ...................... $32,426 $11,479 $ 8,567 $ 7,399 $ 141 $ (2,538) $ 57,474
Income (loss) before interest and income taxes ...... $(4,820) $ (814) $ 789 $ 417 $ (314) $ (45) $ (4,787)
Interest income ............................... 184 184
Interest expense ............................... 694 694
Income tax expense (benefit) .................... (1,000) (1,000)
Net income (loss) attributable to stockholders ....... $ 176 $ (4,297)
Equity in net assets of nonconsolidated affiliates ..... $ 1,928 $ 180 $ 5,798 $ 3 $ 27 $ — $ 7,936
Total assets .................................. $78,719 $18,824 $17,530 $11,295 $36,475 $(26,548) $136,295
Expenditures for property ....................... $ 911 $ 547 $ 272 $ 131 $ 1 $ — $ 1,862
Depreciation, amortization and impairment of long-
lived assets and finite-lived intangible assets .... $ 2,732 $ 938 $ 237 $ 224 $ 110 $ — $ 4,241
Equity income (loss), net of tax .................. $ (7) $ 8 $ 495 $ 1 $ — $ — $ 497
Significant noncash charges (gains)
Contingent Adjustment Shares ................. $ — $ — $ — $ — $ 162 $ — $ 162
Reversal of valuation allowances against deferred
tax assets (a) .............................————(63) — (63)
Impairment charges related to investment in Ally
Financial common stock ....................————270 — 270
UAW OPEB healthcare settlement .............. 2,571——— — —2,571
Total significant noncash charges ................. $ 2,571 $ — $ — $ — $ 369 $ — $ 2,940
(a) Amounts exclude changes related to income tax expense (benefit) in jurisdictions with a full valuation allowance throughout the
period.
General Motors Company 2010 Annual Report 279