HSBC 2014 Annual Report Download - page 3
Download and view the complete annual report
Please find page 3 of the 2014 HSBC annual report below. You can navigate through the pages in the report by either clicking on the pages listed below, or by using the keyword search tool below to find specific information within the annual report.-
 1
1 -
 2
2 -
 3
3 -
 4
4 -
 5
5 -
 6
6 -
 7
7 -
 8
8 -
 9
9 -
 10
10 -
 11
11 -
 12
12 -
 13
13 -
 14
14 -
15
-
16
-
17
-
18
-
19
-
20
-
21
-
22
-
23
-
24
-
25
-
26
-
27
-
28
-
29
-
30
-
31
-
32
-
33
-
34
-
35
-
36
-
37
-
38
-
39
-
40
-
41
-
42
-
43
-
44
-
45
-
46
-
47
-
48
-
49
-
50
-
51
-
52
-
53
-
54
-
55
-
56
-
57
-
58
-
59
-
60
-
61
-
62
-
63
-
64
-
65
-
66
-
67
-
68
-
69
-
70
-
71
-
72
-
73
-
74
-
75
-
76
-
77
-
78
-
79
-
80
-
81
-
82
-
83
-
84
-
85
-
86
-
87
-
88
-
89
-
90
-
91
-
92
-
93
-
94
-
95
-
96
-
97
-
98
-
99
-
100
-
101
-
102
-
103
-
104
-
105
-
106
-
107
-
108
-
109
-
110
-
111
-
112
-
113
-
114
-
115
-
116
-
117
-
118
-
119
-
120
-
121
-
122
-
123
-
124
-
125
-
126
-
127
-
128
-
129
-
130
-
131
-
132
-
133
-
134
-
135
-
136
-
137
-
138
-
139
-
140
-
141
-
142
-
143
-
144
-
145
-
146
-
147
-
148
-
149
-
150
-
151
-
152
-
153
-
154
-
155
-
156
-
157
-
158
-
159
-
160
-
161
-
162
-
163
-
164
-
165
-
166
-
167
-
168
-
169
-
170
-
171
-
172
-
173
-
174
-
175
-
176
-
177
-
178
-
179
-
180
-
181
-
182
-
183
-
184
-
185
-
186
-
187
-
188
-
189
-
190
-
191
-
192
-
193
-
194
-
195
-
196
-
197
-
198
-
199
-
200
 |
 |

HSBC BANK PLC
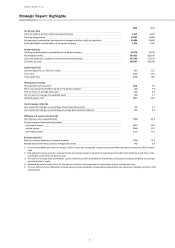
Strategic Report: Highlights
1
2014
2013
For the year (£m)
Profit on ordinary activities before tax (reported basis)
1,953
3,294
Total operating income
14,202
15,868
Net operating income before loan impairment charges and other credit risk provisions
11,886
12,840
Profit attributable to shareholders of the parent company
1,354
2,495
At year-end (£m)
Total equity attributable to shareholders of the parent company
36,078
32,370
Risk weighted assets1
243,652
185,879
Loans and advances to customers (net of impairment allowances)
257,252
273,722
Customer accounts
346,507
346,358
Capital ratios1 (%)
Common Equity Tier 1 / Core Tier 1 ratio
8.7
12.1
Tier 1 ratio
10.3
13.0
Total capital ratio
13.8
18.0
Performance ratios (%)
Risk adjusted revenue growth2
(3.6)
5.6
Return on average shareholders’ equity of the parent company3
4.2
7.9
Post-tax return on average total assets
0.2
0.3
Pre-tax return on average risk-weighted assets
0.8
1.7
Dividend payout ratio4
69.7
48.7
Credit coverage ratios (%)
Loan impairment charges as a percentage of total operating income
3.2
6.1
Loan impairment charges as a percentage of average gross customer advances
0.2
0.4
Efficiency and revenue mix ratios (%)
Cost efficiency ratio (reported basis)5
79.8
66.8
As a percentage of total operating income:
- net interest income
46.7
43.9
- net fee income
23.0
21.0
- net trading income
11.3
15.0
Financial ratios (%)
Ratio of customer advances to customer accounts
74.2
79.0
Average total shareholders’ equity to average total assets
4.2
3.8
1 Current period RWAs and ratios are based on CRD IV rules (refer to page 86). Comparative period RWAs and ratios are based on CRD III capital
rules.
2 Risk-adjusted revenue growth is measured as the percentage change in reported net operating income after loan impairment and other credit
risk charges compared to the previous year.
3 The return on average total shareholders’ equity is defined as profit attributable to shareholders of the parent company divided by the average
total shareholders’ equity.
4 Dividends declared in respect of or for that year per ordinary share expressed as a percentage of basic earnings per share.
5 The cost efficiency ratio is defined as total operating expenses divided by net operating income before loan impairment charges and other credit
risk provisions.