McKesson 2015 Annual Report Download - page 52
Download and view the complete annual report
Please find page 52 of the 2015 McKesson annual report below. You can navigate through the pages in the report by either clicking on the pages listed below, or by using the keyword search tool below to find specific information within the annual report.-
 1
1 -
2
-
3
-
4
-
5
-
6
-
7
-
8
-
9
-
10
-
11
-
12
-
13
-
14
-
15
-
16
-
17
-
18
-
19
-
20
-
21
-
22
-
23
-
24
-
25
-
26
-
27
-
28
-
29
-
30
-
31
-
32
-
33
-
34
-
35
-
36
-
37
-
38
-
39
-
40
-
41
-
 42
42 -
 43
43 -
 44
44 -
 45
45 -
 46
46 -
 47
47 -
 48
48 -
 49
49 -
 50
50 -
 51
51 -
 52
52 -
 53
53 -
 54
54 -
 55
55 -
 56
56 -
 57
57 -
 58
58 -
 59
59 -
 60
60 -
 61
61 -
 62
62 -
63
-
64
-
65
-
66
-
67
-
68
-
69
-
70
-
71
-
72
-
73
-
74
-
75
-
76
-
77
-
78
-
79
-
80
-
81
-
82
-
83
-
84
-
85
-
86
-
87
-
88
-
89
-
90
-
91
-
92
-
93
-
94
-
95
-
96
-
97
-
98
-
99
-
100
-
101
-
102
-
103
-
104
-
105
-
106
-
107
-
108
-
109
-
110
-
111
-
112
-
113
-
114
-
115
-
116
-
117
-
118
-
119
-
120
-
121
-
122
-
123
-
124
-
125
-
126
-
127
-
128
-
129
-
130
-
131
-
132
-
133
-
134
-
135
-
136
-
137
-
138
-
139
-
140
-
141
-
142
-
143
-
144
-
145
-
146
 |
 |
McKESSON CORPORATION
FINANCIAL REVIEW (Continued)
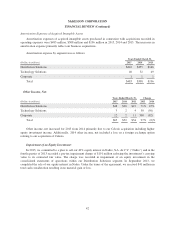
outstanding receivables and other customer financing and adjust allowances for accounts where collection may be
in doubt. During 2015, sales to our ten largest customers accounted for approximately 44% of our total
consolidated revenues. Sales to our largest customer, CVS Caremark Corporation (“CVS”), accounted for
approximately 15% of our total consolidated revenues. At March 31, 2015, trade accounts receivable from our ten
largest customers were approximately 36% of total trade accounts receivable. Accounts receivable from CVS were
approximately 14% of total trade accounts receivable. As a result, our sales and credit concentration is significant.
A default in payments, a material reduction in purchases from these, or any other large customer or the loss of a
large customer could have a material adverse impact on our financial condition, results of operations and liquidity.
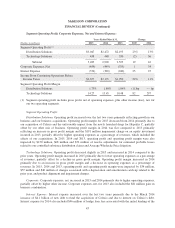
Reserve methodologies are assessed annually based on historical losses and economic, business and market
trends. In addition, reserves are reviewed quarterly and updated if unusual circumstances or trends are present.
We believe the reserves maintained and expenses recorded in 2015 are appropriate and consistent with historical
methodologies employed. At this time, we are not aware of any internal process or customer issues that might
lead to a significant increase in the foreseeable future in our allowance for doubtful accounts as a percentage of
net revenue.
At March 31, 2015, trade and notes receivables were $13,275 million prior to allowances of $141 million. In
2015, 2014 and 2013, our provision for bad debts was $67 million, $36 million and $28 million. At March 31,
2015 and 2014, the allowance as a percentage of trade and notes receivables was 1.1% and 0.9%. An increase or
decrease of a hypothetical 0.1% in the 2015 allowance as a percentage of trade and notes receivables would result
in an increase or decrease in the provision for bad debts of approximately $13 million. The selected 0.1%
hypothetical change does not reflect what could be considered the best or worst case scenarios. Additional
information concerning our allowance for doubtful accounts may be found in Schedule II included in this Annual
Report on Form 10-K.
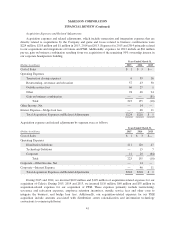
Inventories: We report inventories at the lower of cost or market (“LCM”). Inventories for our Distribution
Solutions segment consist of merchandise held for resale. For our Distribution Solutions segment, the majority of
the cost of domestic inventories is determined using the LIFO method. The majority of the cost of inventories
held in foreign locations is based on weighted average purchase price using the first-in, first-out method
(“FIFO”). Technology Solutions segment inventories consist of computer hardware with cost generally
determined by the standard cost method, which approximates average cost. Rebates, cash discounts and other
incentives received from vendors relating to the purchase or distribution of inventory are considered as product
discounts and are accounted for as a reduction in the cost of inventory and are recognized when the inventory is
sold. Total inventories were $14.3 billion and $13.0 billion at March 31, 2015 and 2014.
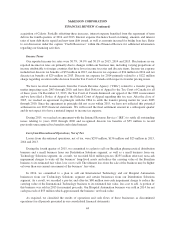
The LIFO method was used to value approximately 73% and 67% of our inventories at March 31, 2015 and
2014. If we had used the FIFO method of inventory valuation, which approximates current replacement costs,
inventories would have been approximately $768 million and $431 million higher than the amounts reported at
March 31, 2015 and 2014. These amounts are equivalent to our LIFO reserves. Our LIFO valuation amount
includes both pharmaceutical and non-pharmaceutical products. In 2015, 2014, and 2013, we recognized net LIFO
expense of $337 million, $311 million and $13 million within our consolidated statements of operations. A LIFO
expense is recognized when the net effect of price increases on branded pharmaceuticals and non-pharmaceutical
products held in inventory exceeds the impact of price declines and shifts towards generic pharmaceuticals,
including the effect of branded pharmaceutical products that have lost market exclusivity. A LIFO credit is
recognized when the net effect of price declines and shifts towards generic pharmaceuticals exceeds the impact of
price increases on branded pharmaceuticals and non-pharmaceutical products held in inventory.
We believe that the average inventory costing method provides a reasonable estimation of the current cost of
replacing inventory (i.e., “market”). As such, our LIFO inventory is valued at the lower of LIFO or market. Due
47