McKesson 2015 Annual Report Download - page 97
Download and view the complete annual report
Please find page 97 of the 2015 McKesson annual report below. You can navigate through the pages in the report by either clicking on the pages listed below, or by using the keyword search tool below to find specific information within the annual report.-
 1
1 -
2
-
3
-
4
-
5
-
6
-
7
-
8
-
9
-
10
-
11
-
12
-
13
-
14
-
15
-
16
-
17
-
18
-
19
-
20
-
21
-
22
-
23
-
24
-
25
-
26
-
27
-
28
-
29
-
30
-
31
-
32
-
33
-
34
-
35
-
36
-
37
-
38
-
39
-
40
-
41
-
42
-
43
-
44
-
45
-
46
-
47
-
48
-
49
-
50
-
51
-
52
-
53
-
54
-
55
-
56
-
57
-
58
-
59
-
60
-
61
-
62
-
63
-
64
-
65
-
66
-
67
-
68
-
69
-
70
-
71
-
72
-
73
-
74
-
75
-
76
-
77
-
78
-
79
-
80
-
81
-
82
-
83
-
84
-
85
-
86
-
 87
87 -
 88
88 -
 89
89 -
 90
90 -
 91
91 -
 92
92 -
 93
93 -
 94
94 -
 95
95 -
 96
96 -
 97
97 -
 98
98 -
 99
99 -
 100
100 -
 101
101 -
 102
102 -
 103
103 -
 104
104 -
 105
105 -
 106
106 -
 107
107 -
108
-
109
-
110
-
111
-
112
-
113
-
114
-
115
-
116
-
117
-
118
-
119
-
120
-
121
-
122
-
123
-
124
-
125
-
126
-
127
-
128
-
129
-
130
-
131
-
132
-
133
-
134
-
135
-
136
-
137
-
138
-
139
-
140
-
141
-
142
-
143
-
144
-
145
-
146
 |
 |
McKESSON CORPORATION
FINANCIAL NOTES (Continued)
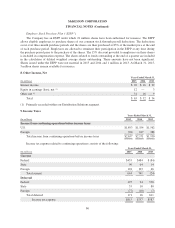
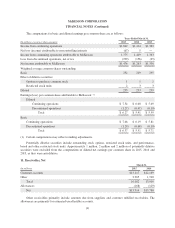
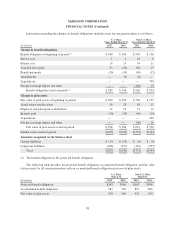
Amortization expense of intangible assets was $494 million, $319 million and $215 million for 2015, 2014
and 2013. Estimated annual amortization expense of intangible assets is as follows: $419 million, $389 million,
$360 million, $332 million and $303 million for 2016 through 2020, and $1,638 million thereafter. All intangible
assets were subject to amortization as of March 31, 2015 and 2014.
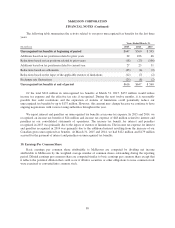
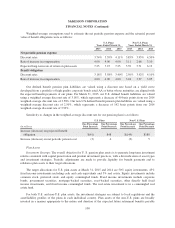
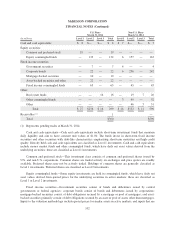
14. Capitalized Software Held for Sale, Net
Changes in the carrying amount of capitalized software held for sale, net, which is included in other assets
in the consolidated balance sheets, were as follows:
Years Ended March 31,
(In millions) 2015 2014 2013
Balance, at beginning of period $103 $126 $144
Amounts capitalized 34 40 49
Amortization expense (40) (50) (56)
Impairment charges — (12) (10)
Foreign currency translations adjustments, net (6) (1) (1)
Balance, at end of period $ 91 $103 $126
Additionally, third party royalty fees paid were $91 million, $91 million and $88 million during 2015, 2014
and 2013.
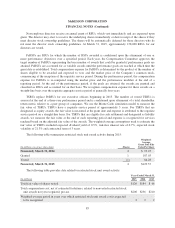
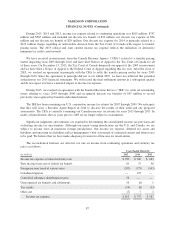
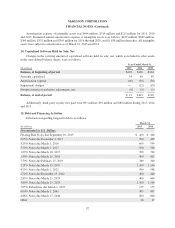
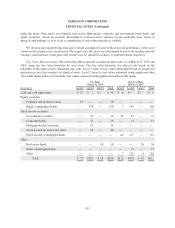
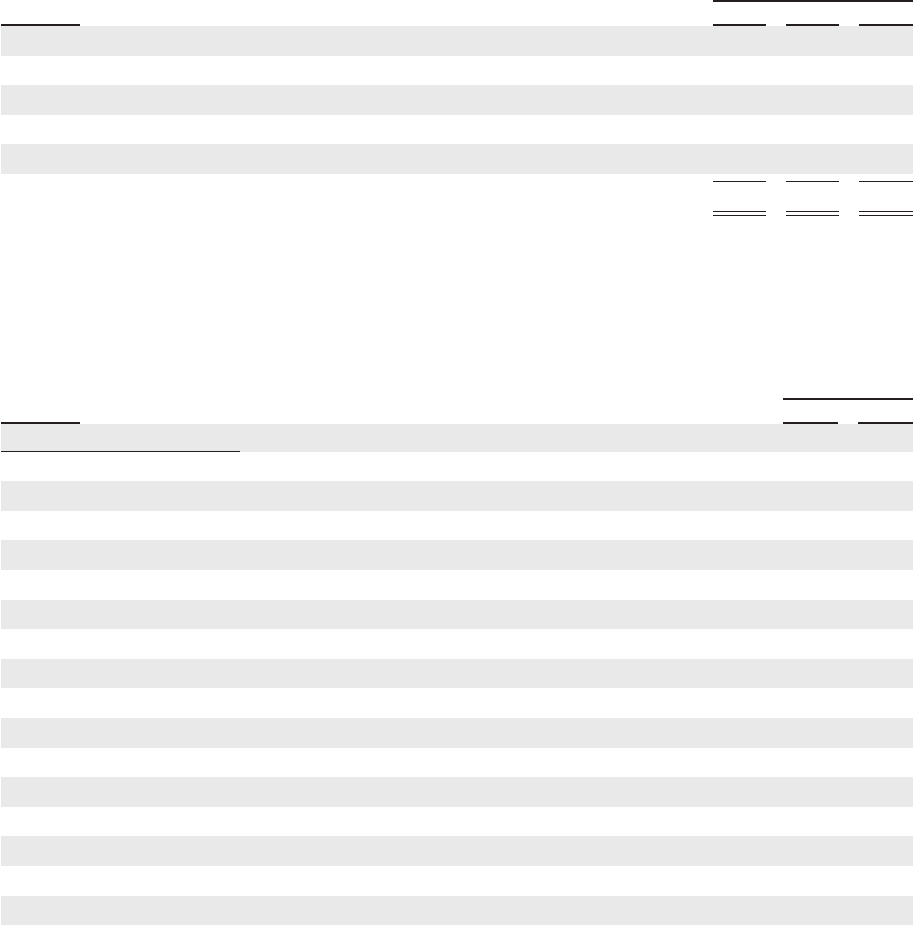
15. Debt and Financing Activities
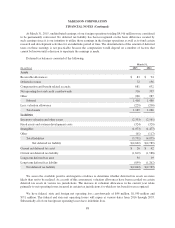
Information regarding long-term debt is as follows:
March 31,
(In millions) 2015 2014
Denominated in U.S. Dollars
Floating Rate Notes due September 10, 2015 $ 400 $ 400
0.95% Notes due December 4, 2015 500 499
3.25% Notes due March 1, 2016 600 599
5.70% Notes due March 1, 2017 500 500
1.29% Notes due March 10, 2017 700 700
1.40% Notes due March 15, 2018 499 499
7.50% Notes due February 15, 2019 349 349
2.28% Notes due March 15, 2019 1,100 1,100
4.75% Notes due March 1, 2021 599 598
2.70% Notes due December 15, 2022 400 400
2.85% Notes due March 15, 2023 400 400
3.80% Notes due March 15, 2024 1,100 1,100
7.65% Debentures due March 1, 2027 175 175
6.00% Notes due March 1, 2041 493 493
4.88% Notes due March 15, 2044 800 800
Other 26 27
92