NVIDIA 2005 Annual Report Download - page 29
Download and view the complete annual report
Please find page 29 of the 2005 NVIDIA annual report below. You can navigate through the pages in the report by either clicking on the pages listed below, or by using the keyword search tool below to find specific information within the annual report.-
 1
1 -
2
-
3
-
4
-
5
-
6
-
7
-
8
-
9
-
10
-
11
-
12
-
13
-
14
-
15
-
16
-
17
-
18
-
 19
19 -
 20
20 -
 21
21 -
 22
22 -
 23
23 -
 24
24 -
 25
25 -
 26
26 -
 27
27 -
 28
28 -
 29
29 -
 30
30 -
 31
31 -
 32
32 -
 33
33 -
 34
34 -
 35
35 -
 36
36 -
 37
37 -
 38
38 -
 39
39 -
40
-
41
-
42
-
43
-
44
-
45
-
46
-
47
-
48
-
49
-
50
-
51
-
52
-
53
-
54
-
55
-
56
-
57
-
58
-
59
-
60
-
61
-
62
-
63
-
64
-
65
-
66
-
67
-
68
-
69
-
70
-
71
-
72
-
73
-
74
-
75
-
76
-
77
-
78
-
79
-
80
-
81
-
82
-
83
-
84
-
85
-
86
-
87
-
88
-
89
-
90
-
91
-
92
-
93
-
94
-
95
-
96
-
97
-
98
-
99
-
100
-
101
-
102
-
103
-
104
-
105
-
106
-
107
-
108
-
109
-
110
-
111
-
112
-
113
-
114
-
115
-
116
-
117
 |
 |

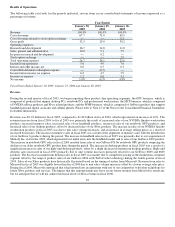
Fiscal 2005 was a 53−week year, compared to fiscal 2004 which was a 52−week year, and we believe that this extra week may have
had a positive impact on our revenue in fiscal 2005. However, we are not able to quantify the effect of the slightly longer year on our
revenue.
Revenue was $1.82 billion in fiscal 2004, compared to $1.91 billion in fiscal 2003, which represented a decrease of 5%. This revenue
decrease was primarily the result of a significant decrease in sales of Xbox processors to Microsoft, offset by growth in our GPU,
MCP and WMP products.
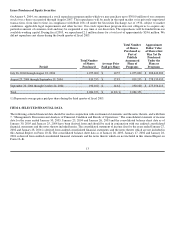
Revenue from sales to customers outside of the United States and other Americas accounted for 76%, 75% and 68% of total revenue
for fiscal 2005, 2004 and 2003, respectively. Revenue by geographic region is allocated to individual countries based on the location
to which the products are initially billed even if the foreign CEMs' and add−in board and motherboard manufacturers' revenue is
attributable to end customers in a different location. The increase in the percentage of revenue from sales to customers outside of the
United States and other Americas for fiscal 2005 as compared to fiscal 2004 and for fiscal 2004 as compared to fiscal 2003 is
primarily due to decreased sales of XGPUs and MCPs used in the Microsoft Xbox product, which are billed to Microsoft in the United
States.
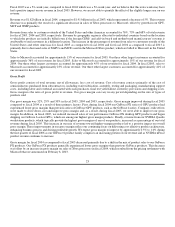
Sales to Microsoft accounted for approximately 13% of our revenue for fiscal 2005. Our three other largest customers accounted for
approximately 36% of our revenue for fiscal 2005. Sales to Microsoft accounted for approximately 15% of our revenue for fiscal
2004. Our three other largest customers accounted for approximately 45% of our revenue for fiscal 2004. In fiscal 2003, sales to
Microsoft accounted for approximately 23% of our revenue. Our three other largest customers accounted for approximately 41% of
our revenue for fiscal 2003.
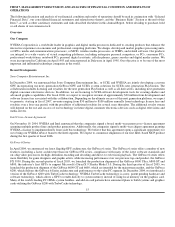
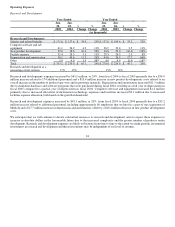
Gross Profit
Gross profit consists of total revenue, net of allowances, less cost of revenue. Cost of revenue consists primarily of the cost of
semiconductors purchased from subcontractors, including wafer fabrication, assembly, testing and packaging, manufacturing support
costs, including labor and overhead associated with such purchases, final test yield fallout, inventory provisions and shipping costs.
Gross margin is the ratio of gross profit to revenue. Our gross margin can vary in any period depending on the mix of types of
products sold.
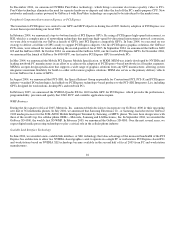
Our gross margin was 32%, 29% and 30% in fiscal 2005, 2004 and 2003, respectively. Gross margin improved during fiscal 2005
compared to fiscal 2004 as a result of three primary factors. First, during fiscal 2004 our GeForce FX series of GPU products had
experienced lower gross margins than previous series of GeForce GPU products, such as the GeForce 4 series. Company−wide efforts
were made to drive down cost and improve gross margin and, as a result, during fiscal 2005, we were able to improve our gross
margin. In addition, in fiscal 2005, we realized increased sales of our performance GeForce FX desktop GPU products and began
shipping our GeForce 6 series GPUs, which are among our highest gross margin products. Finally, revenue from our NVIDIA Quadro
workstation products, which typically provide the highest gross margins of any of our products, increased as a percentage of our total
revenue during fiscal 2005. This increase in our mix of revenue toward higher−margin products led to a positive impact on overall
gross margin. These improvements in our gross margin reflect our continuing focus on delivering cost effective product architecture,
enhancing business process and driving profitable growth. We expect gross margin to improve by approximately 0.5% to 1.0% during
the first quarter of fiscal 2006 as our GeForce 6 product family comprises an increasing portion of our revenue and as NVIDIA nForce
product revenue continues to increase.
Gross margin for fiscal 2004 as compared to fiscal 2003 decreased primarily due to a shift in the mix of product sales to our GeForce
FX products. Our GeForce FX products generally experienced lower gross margins than previous GeForce products. This decrease
was offset by an increase in gross margin on sales of Xbox processors in fiscal 2004, which resulted from the pricing settlement with
Microsoft that we announced on February 6, 2003.
23