NVIDIA 2005 Annual Report Download - page 73
Download and view the complete annual report
Please find page 73 of the 2005 NVIDIA annual report below. You can navigate through the pages in the report by either clicking on the pages listed below, or by using the keyword search tool below to find specific information within the annual report.-
 1
1 -
2
-
3
-
4
-
5
-
6
-
7
-
8
-
9
-
10
-
11
-
12
-
13
-
14
-
15
-
16
-
17
-
18
-
19
-
20
-
21
-
22
-
23
-
24
-
25
-
26
-
27
-
28
-
29
-
30
-
31
-
32
-
33
-
34
-
35
-
36
-
37
-
38
-
39
-
40
-
41
-
42
-
43
-
44
-
45
-
46
-
47
-
48
-
49
-
50
-
51
-
52
-
53
-
54
-
55
-
56
-
57
-
58
-
59
-
60
-
61
-
62
-
 63
63 -
 64
64 -
 65
65 -
 66
66 -
 67
67 -
 68
68 -
 69
69 -
 70
70 -
 71
71 -
 72
72 -
 73
73 -
 74
74 -
 75
75 -
 76
76 -
 77
77 -
 78
78 -
 79
79 -
 80
80 -
 81
81 -
 82
82 -
 83
83 -
84
-
85
-
86
-
87
-
88
-
89
-
90
-
91
-
92
-
93
-
94
-
95
-
96
-
97
-
98
-
99
-
100
-
101
-
102
-
103
-
104
-
105
-
106
-
107
-
108
-
109
-
110
-
111
-
112
-
113
-
114
-
115
-
116
-
117
 |
 |
NVIDIA CORPORATION AND SUBSIDIARIES
NOTES TO CONSOLIDATED FINANCIAL STATEMENTS − (Continued)
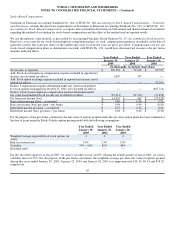
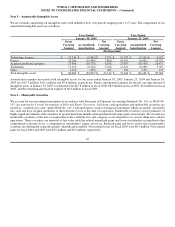
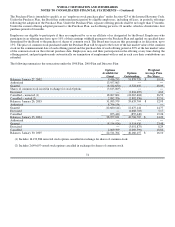
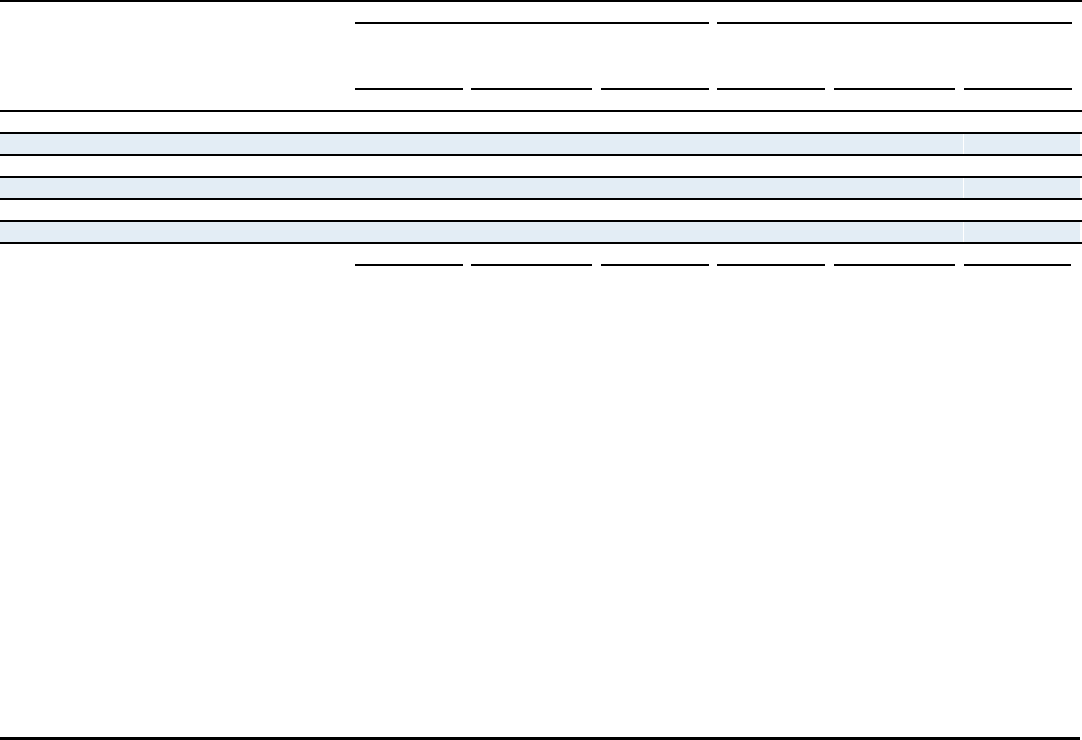
Note 5 − Amortizable Intangible Assets
We are currently amortizing our intangible assets with definitive lives over periods ranging from 1 to 5 years. The components of our
amortizable intangible assets are as follows:
Year Ended Year Ended
January 30, 2005 January 25, 2004
Gross
Carrying
Amount Accumulated
Amortization
Net
Carrying
Amount
Gross
Carrying
Amount Accumulated
Amortization
Net
Carrying
Amount
(In thousands)
Technology licenses $ 17,236 $ (9,841) $ 7,395 $ 15,178 $ (7,161) $ 8,017
Patents 23,260 (15,400) 7,860 19,319 (8,992) 10,327
Acquired intellectual property 27,086 (18,578) 8,508 27,067 (10,590) 16,477
Trademarks 11,310 (8,544) 2,766 11,310 (6,283) 5,027
Other 1,494 (509) 985 250 (135) 115
Total intangible assets $ 80,386 $ (52,872) $ 27,514 $ 73,124 $ (33,161) $ 39,963
Amortization expense associated with intangible assets for the years ended January 30, 2005, January 25, 2004 and January 26,
2003 was $19.7 million, $16.2 million and $9.6 million, respectively. Future amortization expense for the net carrying amount of
intangible assets at January 30, 2005 is estimated to be $15.8 million in fiscal 2006, $8.9 million in fiscal 2007, $2.6 million in fiscal
2008, and the remaining amortization expense of $0.2 million in fiscal 2009.
Note 6 − Marketable Securities
We account for our investment instruments in accordance with Statement of Financial Accounting Standards No. 115, or SFAS No.
115, Accounting for Certain Investments in Debt and Equity Securities. All of our cash equivalents and marketable securities are
treated as “available−for−sale” under SFAS No. 115. Cash equivalents consist of financial instruments which are readily convertible
into cash and have original maturities of three months or less at the time of acquisition. Marketable securities consist primarily of
highly liquid investments with a maturity of greater than three months when purchased and some equity investments. We classify our
marketable securities at the date of acquisition in the available−for−sale category as our intention is to convert them into cash for
operations. These securities are reported at fair value with the related unrealized gains and losses included in accumulated other
comprehensive income (loss), a component of stockholders' equity, net of tax. Realized gains and losses on the sale of marketable
securities are determined using the specific−identification method. Net realized losses for fiscal 2005 were $0.4 million. Net realized
gains for fiscal 2004 and 2003 were $2.9 million and $0.3 million, respectively.
67