NVIDIA 2005 Annual Report Download - page 60
Download and view the complete annual report
Please find page 60 of the 2005 NVIDIA annual report below. You can navigate through the pages in the report by either clicking on the pages listed below, or by using the keyword search tool below to find specific information within the annual report.-
 1
1 -
2
-
3
-
4
-
5
-
6
-
7
-
8
-
9
-
10
-
11
-
12
-
13
-
14
-
15
-
16
-
17
-
18
-
19
-
20
-
21
-
22
-
23
-
24
-
25
-
26
-
27
-
28
-
29
-
30
-
31
-
32
-
33
-
34
-
35
-
36
-
37
-
38
-
39
-
40
-
41
-
42
-
43
-
44
-
45
-
46
-
47
-
48
-
49
-
 50
50 -
 51
51 -
 52
52 -
 53
53 -
 54
54 -
 55
55 -
 56
56 -
 57
57 -
 58
58 -
 59
59 -
 60
60 -
 61
61 -
 62
62 -
 63
63 -
 64
64 -
 65
65 -
 66
66 -
 67
67 -
 68
68 -
 69
69 -
 70
70 -
71
-
72
-
73
-
74
-
75
-
76
-
77
-
78
-
79
-
80
-
81
-
82
-
83
-
84
-
85
-
86
-
87
-
88
-
89
-
90
-
91
-
92
-
93
-
94
-
95
-
96
-
97
-
98
-
99
-
100
-
101
-
102
-
103
-
104
-
105
-
106
-
107
-
108
-
109
-
110
-
111
-
112
-
113
-
114
-
115
-
116
-
117
 |
 |

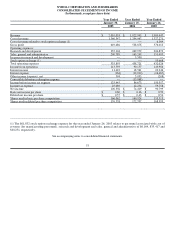
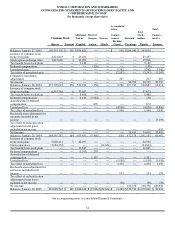
NVIDIA CORPORATION AND SUBSIDIARIES
CONSOLIDATED STATEMENTS OF STOCKHOLDERS' EQUITY AND
COMPREHENSIVE INCOME
(In thousands, except share data)
Accumulated
Other Total
Additional Deferred Compre− Total
Stock− Compre−
Common Stock Paid in Compen− Treasury hensive Retained holders' hensive
Shares Amount Capital sation Stock Income
(Loss) Earnings Equity Income
Balances, January 27, 2002 149,553,130 $ 150 $ 456,621 −− −− $ 108 $306,940 $ 763,819
Issuance of common stock
from stock plans 4,421,823 4 25,483 −− −− −− −− 25,487
Stock option exchange offer 3,815,069 4 39,902 −− −− −− −− 39,906
Tax benefit from stock plans −− −− 9,180 −− −− −− −− 9,180
Deferred compensation −− −− −− (156) −− −− −− (156)
Unrealized gain −− −− −− −− −− 5,742 −− 5,742 5,742
Tax effect of unrealized gain −− −− −− −− −− (2,297) −− (2,297) (2,297)
Cumulative translation
adjustments −− −− −− −− −− 207 −− 207 207
Net income −− −− −− −− −− −− 90,799 90,799 90,799
Balances, January 26, 2003 157,790,022 158 531,186 (156) −− 3,760 397,739 932,687 94,451
Issuance of common stock
from stock plans 6,355,765 6 37,667 −− −− −− −− 37,673
Tax benefit from stock plans −− −− 8,488 −− −− −− −− 8,488
Deferred compensation −− −− 6,140 (5,984) −− −− −− 156
Amortization of deferred
compensation −− −− −− 672 −− −− −− 672
Unrealized loss −− −− −− −− −− (4,850) −− (4,850) (4,850)
Tax effect of unrealized loss −− −− −− −− −− 1,940 −− 1,940 1,940
Reclassification adjustment for
net gains included in net
income −− −− −− −− −− −− −− −− (3,159)
Tax effect of reclassification
adjustment for net gains
included in net income −− −− −− −− −− −− −− −− 632
Net income −− −− −− −− −− −− 74,419 74,419 74,419
Balances, January 25, 2004 164,145,787 164 583,481 (5,468) −− 850 472,158 1,051,185 68,982
Issuance of common stock
from stock plans 5,028,111 5 42,497 −− −− −− −− 42,502
Stock repurchase (2,084,353) −− −− −− (24,644) −− −− (24,644)
Tax benefit from stock plans −− −− 11,845 −− −− −− −− 11,845
Deferred compensation −− −− (1,205) 1,205 −− −− −− −−
Amortization of deferred
compensation −− −− −− 1,337 −− −− −− 1,337
Unrealized loss −− −− −− −− −− (5,938) −− (5,938) (5,938)
Tax effect of unrealized loss −− −− −− −− −− 1,470 −− 1,470 1,470
Reclassification adjustment for
net losses included in net
income −− −− −− −− −− 193 −− 193 193
Tax effect of reclassification
adjustment for net losses
included in net income −− −− −− −− −− (38) −− (38) (38)
Net income −− −− −− −− −− −− 100,356 100,356 100,356
Balances, January 30, 2005 167,089,545 $ 169 $ 636,618 $ (2,926)$(24,644)$ (3,463) $572,514 $1,178,268 $ 96,043
See accompanying notes to consolidated financial statements.
54