Napa Auto Parts 2009 Annual Report Download - page 15
Download and view the complete annual report
Please find page 15 of the 2009 Napa Auto Parts annual report below. You can navigate through the pages in the report by either clicking on the pages listed below, or by using the keyword search tool below to find specific information within the annual report.-
 1
1 -
2
-
3
-
4
-
 5
5 -
 6
6 -
 7
7 -
 8
8 -
 9
9 -
 10
10 -
 11
11 -
 12
12 -
 13
13 -
 14
14 -
 15
15 -
 16
16 -
 17
17 -
 18
18 -
 19
19 -
 20
20 -
 21
21 -
 22
22 -
 23
23 -
 24
24 -
 25
25 -
26
-
27
-
28
-
29
-
30
-
31
-
32
-
33
-
34
-
35
-
36
-
37
-
38
-
39
-
40
-
41
-
42
-
43
-
44
-
45
-
46
-
47
-
48
-
49
-
50
-
51
-
52
-
53
-
54
-
55
-
56
-
57
-
58
-
59
-
60
-
61
-
62
-
63
-
64
-
65
-
66
-
67
-
68
-
69
-
70
-
71
 |
 |

Table of Contents
This improvement is due mainly to the decrease in inventory and increase in accounts payable in 2009 relative to 2008. In addition, we
were less active in our share repurchase program during 2009 when compared to 2008. Accounts receivable decreased by approximately
3%, inventory was down by approximately 4% and accounts payable increased $85 million or 8% from the prior year, due primarily to
improved payment terms with certain suppliers and the ongoing expansion of our procurement card program. Total debt outstanding at
December 31, 2009 was unchanged from $500 million at December 31, 2008.
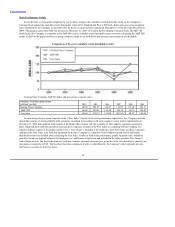
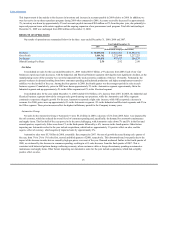
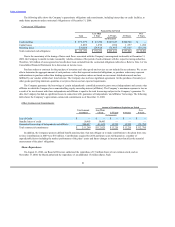
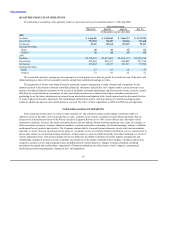
Our results of operations are summarized below for the three years ended December 31, 2009, 2008 and 2007.
Net Sales $11,015,263 $ 10,843,195
Gross Profit 3,272,490 3,217,223
Net Income 475,417 506,339
Diluted Earnings Per Share 2.92 2.98
Consolidated net sales for the year ended December 31, 2009 totaled $10.1 billion, a 9% decrease from 2008. Each of our four
businesses experienced sales decreases, with the Industrial and Electrical business segments showing the most significant declines, as the
manufacturing sector of the economy was severely impacted by the weak economic conditions of the last 15 months. Fortunately, the
general weakness in demand resulting from lower consumer spending and industrial production and higher unemployment seemed to
stabilize over the last half of the year. Among the four quarters in 2009, the fourth quarter was the strongest period for sales in each
business segment. Cumulatively, prices in 2009 were down approximately 3% in the Automotive segment, approximately flat in the
Industrial segment and up approximately 4% in the Office segment and 2% in the Electrical segment.
Consolidated sales for the year ended December 31, 2008 totaled $11.0 billion, a 2% increase from 2007. In 2008, the Industrial and
Electrical business segments showed the strongest sales growth among our operations, while the Automotive and Office segments
continued to experience sluggish growth. For the year, Automotive reported a slight sales increase, while Office reported a decrease in
revenues. For 2008, prices were up approximately 6% in the Automotive segment, 8% in the Industrial and Electrical segments and 4% in
the Office segment. These price increases reflect the highest inflationary period for the Company in many years.
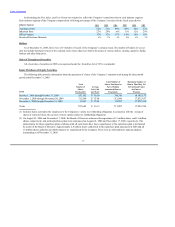
Automotive Group
Net sales for the Automotive Group (“Automotive”) were $5.2 billion in 2009, a decrease of 2% from 2008. Sales were impacted by
the soft economy, which has reduced the overall level of consumer spending and, specifically, the demand for automotive maintenance
and supply items. The first half of the year proved to be the most challenging, with Automotive sales down 7% and 5% in the first and
second quarters, respectively. Sales were down 1% in the third quarter followed by a 6% increase in the fourth quarter. Other factors
impacting our Automotive sales for the year include acquisitions, which had an approximately 1% positive effect on sales, and the
negative effect of currency, which negatively impacted sales by approximately 2%.
Automotive sales were $5.3 billion in 2008, essentially flat compared to 2007. Our rate of growth decreased during each quarter of
the year, from 3% to 2% to 1% in the first, second and third quarters of 2008, respectively. This downward trend was partly due to the
impact of the decrease in miles driven caused by high gas prices over most of the year. Demand weakened further in the fourth quarter of
2008, as evidenced by the decrease in consumer spending, resulting in a 6% sales decrease from the final quarter of 2007. This is
consistent with historical patterns during a softening economy, when consumers defer or forego discretionary spending on automotive
maintenance and supply items. Other factors impacting our Automotive sales for the year include acquisitions, which had a slightly
positive effect on sales.
15