Napa Auto Parts 2009 Annual Report Download - page 17
Download and view the complete annual report
Please find page 17 of the 2009 Napa Auto Parts annual report below. You can navigate through the pages in the report by either clicking on the pages listed below, or by using the keyword search tool below to find specific information within the annual report.-
 1
1 -
2
-
3
-
4
-
5
-
6
-
 7
7 -
 8
8 -
 9
9 -
 10
10 -
 11
11 -
 12
12 -
 13
13 -
 14
14 -
 15
15 -
 16
16 -
 17
17 -
 18
18 -
 19
19 -
 20
20 -
 21
21 -
 22
22 -
 23
23 -
 24
24 -
 25
25 -
 26
26 -
 27
27 -
28
-
29
-
30
-
31
-
32
-
33
-
34
-
35
-
36
-
37
-
38
-
39
-
40
-
41
-
42
-
43
-
44
-
45
-
46
-
47
-
48
-
49
-
50
-
51
-
52
-
53
-
54
-
55
-
56
-
57
-
58
-
59
-
60
-
61
-
62
-
63
-
64
-
65
-
66
-
67
-
68
-
69
-
70
-
71
 |
 |

Table of Contents
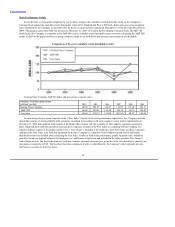
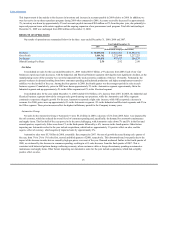
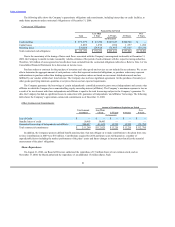
represented 70.1% of net sales in 2009 and 70.3% of net sales in 2008 and 2007. The relatively constant rate over these three periods
reflects how our ongoing gross margin initiatives to enhance our pricing strategies, promote and sell higher margin products and minimize
material acquisition costs were generally offset by increasing competitive pricing pressures in the markets we serve.
In 2009, our Office and Electrical business segments experienced vendor price increases. Industrial was flat and Automotive pricing
was down for the year. In 2008 and 2007, all four of our business segments experienced vendor price increases. In any year where we
experience price increases, we are able to work with our customers to pass most of these along to them.
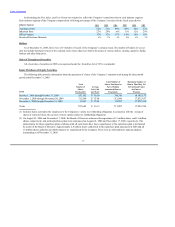
Selling, administrative and other expenses (“SG&A”) decreased by $140 million to $2.2 billion in 2009, representing 22.1% of net
sales and up from 21.4% of net sales in 2008. SG&A expenses as a percentage of net sales increased from the prior year due primarily to
the loss of expense leverage associated with the 9% sales decrease for the year. During 2009, management continued its implementation of
extensive cost control initiatives to offset this loss of leverage. These measures emphasize continuous improvement programs designed to
optimize our utilization of people and systems and, for the year, we eliminated approximately $70 million in operating costs. Examples of
such savings include costs associated with personnel, freight, fleet and logistics, among others. The Company reduced its workforce by
7% in 2009 (before consideration of acquisitions) and this follows a 5% reduction in employees in 2008. Severance and other termination
benefits associated with these employee reductions were insignificant. Our management teams remain focused on the ongoing assessment
of the appropriate cost structure in our businesses and the need for additional cost reductions, while maintaining our high standards for
excellent customer service.
Depreciation and amortization expense in 2009 was $90 million, up slightly from 2008. The provision for doubtful accounts was
$28 million in 2009, up from a $24 million bad debt expense in 2008. Our bad debt expense reflects an increase in uncollectible accounts
receivables in 2009 and is likely directly correlated to the ongoing effects of the difficult economic climate, which has pressured certain of
our customers. We believe the Company is adequately reserved for bad debts at December 31, 2009.
In 2008, SG&A was $2.4 billion, or 21.4% of net sales, which was an increase from 2007 when SG&A as a percentage of net sales
was 21.0%. This increase was mainly due to the loss of leverage on the lower level of sales growth in 2008 relative to the prior year, which
offset the benefits of our ongoing cost control initiatives. Depreciation and amortization expense in 2008 was $89 million, relatively
consistent with 2007. The provision for doubtful accounts was $24 million in 2008, up from a $14 million bad debt expense in 2007.
Total share-based compensation expense for the years ended December 31, 2009, 2008 and 2007, was $8.6 million, $13.0 million,
and $14.3 million, respectively. Refer to Note 5 of the Consolidated Financial Statements for further information regarding share-based
compensation.
Non-operating expenses consist primarily of interest. Interest expense was $28 million in 2009, a decrease from $32 million and
$31 million in 2008 and 2007, respectively. The decrease is the result of an improved interest rate on certain long-term debt, effective
November 2008.
In “Other”, interest income net of noncontrolling interests increased in 2009 from 2008 due primarily to the elimination of certain
noncontrolling interests in 2009. In 2008, interest income net of noncontrolling interests decreased from 2007 due to the effects of lower
interest rates.
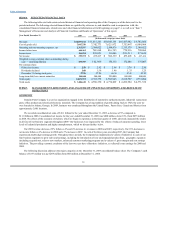
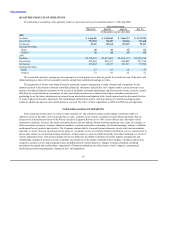
Income before income taxes was $644 million in 2009, a decrease of 16.0% from $768 million in 2008. As a percentage of net sales,
income before income taxes was 6.4% in 2009, reflecting a decrease from 7.0% in 2008. In 2008, income before income taxes of
$768 million was down 5.9% from $817 million in 2007 and as a percentage of net sales was 7.0%, a decrease from 7.5% in 2007.
17