Neiman Marcus 2012 Annual Report Download - page 109
Download and view the complete annual report
Please find page 109 of the 2012 Neiman Marcus annual report below. You can navigate through the pages in the report by either clicking on the pages listed below, or by using the keyword search tool below to find specific information within the annual report.-
 1
1 -
2
-
3
-
4
-
5
-
6
-
7
-
8
-
9
-
10
-
11
-
12
-
13
-
14
-
15
-
16
-
17
-
18
-
19
-
20
-
21
-
22
-
23
-
24
-
25
-
26
-
27
-
28
-
29
-
30
-
31
-
32
-
33
-
34
-
35
-
36
-
37
-
38
-
39
-
40
-
41
-
42
-
43
-
44
-
45
-
46
-
47
-
48
-
49
-
50
-
51
-
52
-
53
-
54
-
55
-
56
-
57
-
58
-
59
-
60
-
61
-
62
-
63
-
64
-
65
-
66
-
67
-
68
-
69
-
70
-
71
-
72
-
73
-
74
-
75
-
76
-
77
-
78
-
79
-
80
-
81
-
82
-
83
-
84
-
85
-
86
-
87
-
88
-
89
-
90
-
91
-
92
-
93
-
94
-
95
-
96
-
97
-
98
-
 99
99 -
 100
100 -
 101
101 -
 102
102 -
 103
103 -
 104
104 -
 105
105 -
 106
106 -
 107
107 -
 108
108 -
 109
109 -
 110
110 -
 111
111 -
 112
112 -
 113
113 -
 114
114 -
 115
115 -
 116
116 -
 117
117 -
 118
118 -
 119
119 -
120
-
121
-
122
-
123
-
124
-
125
-
126
-
127
-
128
-
129
-
130
-
131
-
132
-
133
-
134
-
135
-
136
-
137
-
138
-
139
-
140
-
141
-
142
-
143
-
144
-
145
-
146
-
147
-
148
-
149
-
150
-
151
-
152
-
153
-
154
-
155
-
156
-
157
-
158
-
159
-
160
-
161
-
162
-
163
-
164
-
165
-
166
-
167
-
168
-
169
-
170
-
171
-
172
-
173
-
174
-
175
-
176
-
177
 |
 |

Table of Contents
In February 2013, the FASB issued guidance to improve the reporting of reclassifications out of accumulated other comprehensive earnings
depending on the significance of the reclassifications and whether they are required by U.S. generally accepted accounting principles (GAAP). This guidance
is effective for fiscal years and interim periods within those years beginning after December 15, 2012, which is effective for us as of the first quarter of fiscal
year 2014. We do not expect that the implementation of this standard will have a material impact on our Consolidated Financial Statements.
In July 2013, the FASB issued guidance to improve the reporting of unrecognized tax benefits when a net operating loss carryforward, a similar tax
loss or a tax credit carryforward exists. This guidance is effective for fiscal years and interim periods within those years beginning after December 15, 2013,
which is effective for us as of the first quarter of fiscal year 2015. We do not expect that the implementation of this standard will have a material impact on our
Consolidated Financial Statements.
NOTE 2. FAIR VALUE MEASUREMENTS
Fair value is the price that would be received upon sale of an asset or paid upon transfer of a liability in an orderly transaction between market
participants at the measurement date and in the principal or most advantageous market for that asset or liability. Assets and liabilities are classified using a
fair value hierarchy that prioritizes the inputs to valuation techniques used to measure fair value as follows:
· Level 1 — Unadjusted quoted prices for identical instruments traded in active markets.
· Level 2 — Observable market-based inputs or unobservable inputs corroborated by market data.
· Level 3 — Unobservable inputs reflecting management’s estimates and assumptions.
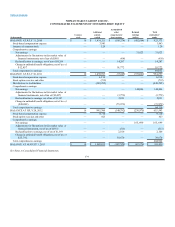
The following table shows the Company’s financial assets that are required to be measured at fair value on a recurring basis in our Consolidated
Balance Sheets:
(in thousands)
Fair Value
Hierarchy
August 3,
2013
July 28,
2012
Other long-term assets:
Interest rate caps Level 2 $29 $ 531
The fair value of the interest rate caps are estimated using industry standard valuation models using market-based observable inputs, including
interest rate curves. In addition, the fair value of the interest rate caps includes consideration of the counterparty’s non-performance risk.
Financial instruments not measured at fair value on a recurring basis include cash and cash equivalents, credit card receivables and accounts
payable, which approximate fair value due to their short-term nature. We also determine the fair value of our long-term debt on a non-recurring basis, which
results are summarized as follows:
August 3, 2013 July 28, 2012
(in thousands)
Fair Value
Hierarchy
Carrying
Value
Fair
Value
Carrying
Value
Fair
Value
Long-term debt:
Senior Secured Asset-Based Revolving Credit Facility Level 2 $15,000 $15,000 $100,000 $100,000
Senior Secured Term Loan Facility Level 2 2,560,000 2,566,400 2,060,000 2,047,125
2028 Debentures Level 2 122,077 125,625 121,882 118,125
Senior Subordinated Notes Level 2 — — 500,000 516,255
We estimated the fair value of long-term debt using similar rates offered for debt of similar remaining maturities and credit risk for the Senior
Secured Asset-Based Revolving Credit Facility, prevailing market rates for the Senior Secured Term Loan Facility and quoted market prices of the same or
similar issues for the 2028 Debentures and Senior Subordinated Notes.
F-15