Neiman Marcus 2012 Annual Report Download - page 60
Download and view the complete annual report
Please find page 60 of the 2012 Neiman Marcus annual report below. You can navigate through the pages in the report by either clicking on the pages listed below, or by using the keyword search tool below to find specific information within the annual report.-
 1
1 -
2
-
3
-
4
-
5
-
6
-
7
-
8
-
9
-
10
-
11
-
12
-
13
-
14
-
15
-
16
-
17
-
18
-
19
-
20
-
21
-
22
-
23
-
24
-
25
-
26
-
27
-
28
-
29
-
30
-
31
-
32
-
33
-
34
-
35
-
36
-
37
-
38
-
39
-
40
-
41
-
42
-
43
-
44
-
45
-
46
-
47
-
48
-
49
-
 50
50 -
 51
51 -
 52
52 -
 53
53 -
 54
54 -
 55
55 -
 56
56 -
 57
57 -
 58
58 -
 59
59 -
 60
60 -
 61
61 -
 62
62 -
 63
63 -
 64
64 -
 65
65 -
 66
66 -
 67
67 -
 68
68 -
 69
69 -
 70
70 -
71
-
72
-
73
-
74
-
75
-
76
-
77
-
78
-
79
-
80
-
81
-
82
-
83
-
84
-
85
-
86
-
87
-
88
-
89
-
90
-
91
-
92
-
93
-
94
-
95
-
96
-
97
-
98
-
99
-
100
-
101
-
102
-
103
-
104
-
105
-
106
-
107
-
108
-
109
-
110
-
111
-
112
-
113
-
114
-
115
-
116
-
117
-
118
-
119
-
120
-
121
-
122
-
123
-
124
-
125
-
126
-
127
-
128
-
129
-
130
-
131
-
132
-
133
-
134
-
135
-
136
-
137
-
138
-
139
-
140
-
141
-
142
-
143
-
144
-
145
-
146
-
147
-
148
-
149
-
150
-
151
-
152
-
153
-
154
-
155
-
156
-
157
-
158
-
159
-
160
-
161
-
162
-
163
-
164
-
165
-
166
-
167
-
168
-
169
-
170
-
171
-
172
-
173
-
174
-
175
-
176
-
177
 |
 |

Table of Contents
Annual Incentive Bonus. In determining annual incentive bonus amounts for the named executive officers, the Compensation Committee considers
their performance relative to the pre-established goals that are set at the beginning of the year. The pre-established goals for fiscal year 2013 for each of our
named executive officers are discussed under the heading “Corporate Performance Targets” that follows. The Compensation Committee set the threshold,
target, and maximum performance targets at levels they believed were challenging based on historical company performance and industry and market
conditions. Goals were established at the division and business unit levels where appropriate for each of the named executive officers. As it relates to our
annual incentive compensation program, this performance assessment is a key variable in determining the amount of total compensation paid to our named
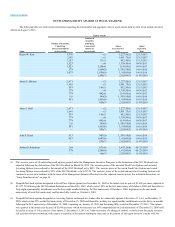
executive officers. Fiscal year 2013 target annual incentives and relative performance weights for the named executive officers were as follows:
Relative Performance Weights
Name
Target Bonus
As Percent of
Base Salary
NMG
Metrics
NMD
Metrics
NMS
Metrics
NMS/BG
Metrics
BG
Metrics
BG
Online
Sales
Karen W. Katz 100%100%—————
James E. Skinner 75%100%—————
James J. Gold 75%25%15%— 60%— —
John E. Koryl 60%25%60%15%———
Joshua G. Schulman 60%30%— — — 60%10%
Ms. Katz, the individual with the greatest overall responsibility for company performance, was granted the largest incentive opportunity in
comparison to her base salary in order to weight her annual cash compensation mix more heavily towards performance-based compensation. Since Messrs.
Gold, Koryl, and Schulman each have responsibility over a particular division, performance goals are more heavily weighted toward the operational
performance of their respective division.
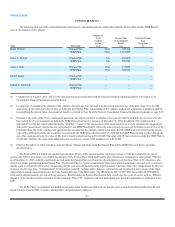
Corporate Performance Targets. At the end of each fiscal year, the Compensation Committee evaluates the Company’s performance against the
financial and strategic performance targets set at the beginning of the fiscal year. For fiscal year 2013, the bonus metrics for the named executive officers were
based on the following:
Named Executive Officer Bonus Metrics
Ms. Katz and Mr. Skinner · Consolidated EBITDA, sales and ROIC for The Neiman Marcus Group, Inc.
Mr. Gold · Consolidated EBITDA and sales for The Neiman Marcus Group, Inc.
· EBITDA, sales and inventory turnover for Neiman Marcus Stores/Bergdorf Goodman
· EBITDA, sales, visitors and conversion at Neiman Marcus Direct
Mr. Koryl · Consolidated EBITDA and sales for The Neiman Marcus Group, Inc.
· EBITDA, sales, conversion and traffic/number of website visitors at Neiman Marcus Direct
· EBITDA, sales and inventory turnover at Neiman Marcus Stores
Mr. Schulman · Consolidated EBITDA and sales for The Neiman Marcus Group, Inc.
· EBITDA, sales, inventory turnover and online sales for Bergdorf Goodman
Metrics used for each executive, as well as the relative weights assigned to the metrics, are based on strategic business drivers of the particular
business unit or division that the executive manages. Bonus metrics related to threshold, target and maximum annual incentive bonus payouts for fiscal year
2013, as well as actual amounts achieved and actual payout percentages for fiscal year 2013 are as follows:
58