Neiman Marcus 2012 Annual Report Download - page 131
Download and view the complete annual report
Please find page 131 of the 2012 Neiman Marcus annual report below. You can navigate through the pages in the report by either clicking on the pages listed below, or by using the keyword search tool below to find specific information within the annual report.-
 1
1 -
2
-
3
-
4
-
5
-
6
-
7
-
8
-
9
-
10
-
11
-
12
-
13
-
14
-
15
-
16
-
17
-
18
-
19
-
20
-
21
-
22
-
23
-
24
-
25
-
26
-
27
-
28
-
29
-
30
-
31
-
32
-
33
-
34
-
35
-
36
-
37
-
38
-
39
-
40
-
41
-
42
-
43
-
44
-
45
-
46
-
47
-
48
-
49
-
50
-
51
-
52
-
53
-
54
-
55
-
56
-
57
-
58
-
59
-
60
-
61
-
62
-
63
-
64
-
65
-
66
-
67
-
68
-
69
-
70
-
71
-
72
-
73
-
74
-
75
-
76
-
77
-
78
-
79
-
80
-
81
-
82
-
83
-
84
-
85
-
86
-
87
-
88
-
89
-
90
-
91
-
92
-
93
-
94
-
95
-
96
-
97
-
98
-
99
-
100
-
101
-
102
-
103
-
104
-
105
-
106
-
107
-
108
-
109
-
110
-
111
-
112
-
113
-
114
-
115
-
116
-
117
-
118
-
119
-
120
-
 121
121 -
 122
122 -
 123
123 -
 124
124 -
 125
125 -
 126
126 -
 127
127 -
 128
128 -
 129
129 -
 130
130 -
 131
131 -
 132
132 -
 133
133 -
 134
134 -
 135
135 -
 136
136 -
 137
137 -
 138
138 -
 139
139 -
 140
140 -
 141
141 -
142
-
143
-
144
-
145
-
146
-
147
-
148
-
149
-
150
-
151
-
152
-
153
-
154
-
155
-
156
-
157
-
158
-
159
-
160
-
161
-
162
-
163
-
164
-
165
-
166
-
167
-
168
-
169
-
170
-
171
-
172
-
173
-
174
-
175
-
176
-
177
 |
 |
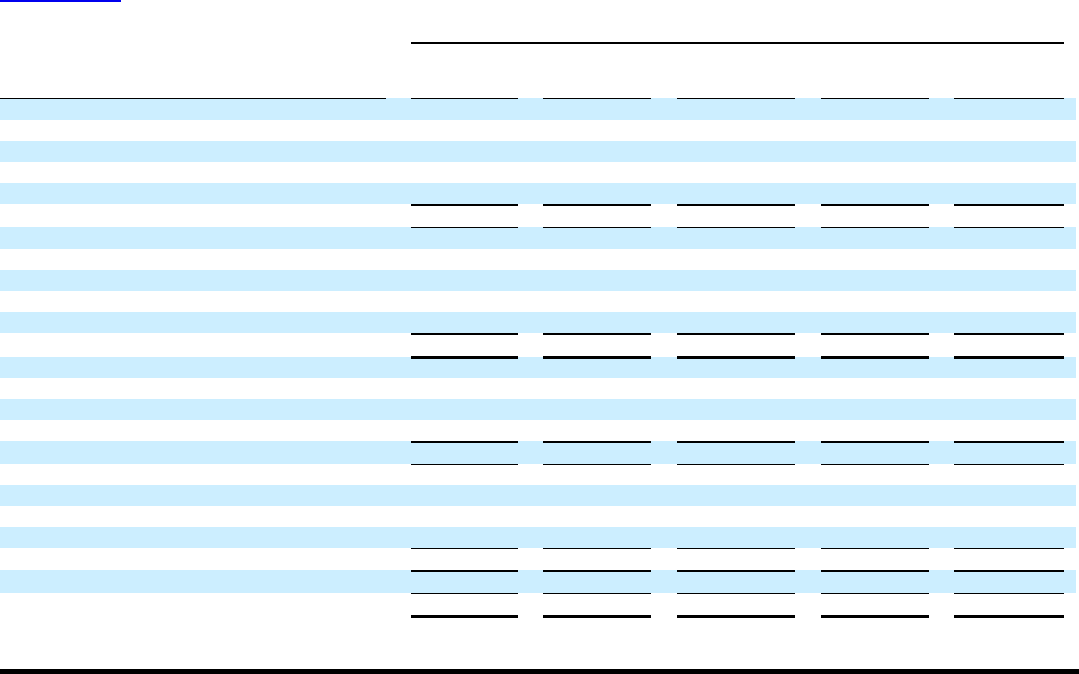
Table of Contents
July 28, 2012
(in thousands) Company NMG
Non-
Guarantor
Subsidiaries Eliminations Consolidated
ASSETS
Current assets:
Cash and cash equivalents $ — $ 48,308 $945 $ — $ 49,253
Merchandise inventories —838,837 100,980 —939,817
Other current assets — 141,913 12,752 —154,665
Total current assets —1,029,058 114,677 — 1,143,735
Property and equipment, net —788,320 106,158 — 894,478
Goodwill —1,107,753 155,680 —1,263,433
Intangible assets, net —280,848 1,548,736 —1,829,584
Other assets —41,113 29,512 —70,625
Investments in subsidiaries 615,543 1,853,889 — (2,469,432) —
Total assets $615,543 $5,100,981 $1,954,763 $ (2,469,432) $ 5,201,855
LIABILITIES AND STOCKHOLDERS’ EQUITY
Current liabilities:
Accounts payable $ — $ 303,397 $28,011 $ — $ 331,408
Accrued liabilities —322,699 71,122 — 393,821
Total current liabilities —626,096 99,133 —725,229
Long-term liabilities:
Long-term debt —2,781,882 — — 2,781,882
Deferred income taxes —626,605 — — 626,605
Other long-term liabilities —450,855 1,741 — 452,596
Total long-term liabilities —3,859,342 1,741 — 3,861,083
Total stockholders’ equity 615,543 615,543 1,853,889 (2,469,432) 615,543
Total liabilities and stockholders’ equity $615,543 $5,100,981 $1,954,763 $ (2,469,432)$5,201,855
F-37