Porsche 2007 Annual Report Download - page 149
Download and view the complete annual report
Please find page 149 of the 2007 Porsche annual report below. You can navigate through the pages in the report by either clicking on the pages listed below, or by using the keyword search tool below to find specific information within the annual report.-
 1
1 -
2
-
3
-
4
-
5
-
6
-
7
-
8
-
9
-
10
-
11
-
12
-
13
-
14
-
15
-
16
-
17
-
18
-
19
-
20
-
21
-
22
-
23
-
24
-
25
-
26
-
27
-
28
-
29
-
30
-
31
-
32
-
33
-
34
-
35
-
36
-
37
-
38
-
39
-
40
-
41
-
42
-
43
-
44
-
45
-
46
-
47
-
48
-
49
-
50
-
51
-
52
-
53
-
54
-
55
-
56
-
57
-
58
-
59
-
60
-
61
-
62
-
63
-
64
-
65
-
66
-
67
-
68
-
69
-
70
-
71
-
72
-
73
-
74
-
75
-
76
-
77
-
78
-
79
-
80
-
81
-
82
-
83
-
84
-
85
-
86
-
87
-
88
-
89
-
90
-
91
-
92
-
93
-
94
-
95
-
96
-
97
-
98
-
99
-
100
-
101
-
102
-
103
-
104
-
105
-
106
-
107
-
108
-
109
-
110
-
111
-
112
-
113
-
114
-
115
-
116
-
117
-
118
-
119
-
120
-
121
-
122
-
123
-
124
-
125
-
126
-
127
-
128
-
129
-
130
-
131
-
132
-
133
-
134
-
135
-
136
-
137
-
138
-
 139
139 -
 140
140 -
 141
141 -
 142
142 -
 143
143 -
 144
144 -
 145
145 -
 146
146 -
 147
147 -
 148
148 -
 149
149 -
 150
150 -
 151
151 -
 152
152 -
 153
153 -
 154
154 -
 155
155 -
 156
156 -
 157
157 -
 158
158 -
 159
159 -
160
-
161
-
162
-
163
-
164
-
165
-
166
-
167
-
168
-
169
-
170
-
171
-
172
-
173
-
174
-
175
-
176
-
177
-
178
-
179
-
180
-
181
-
182
-
183
-
184
-
185
-
186
-
187
-
188
-
189
-
190
-
191
-
192
-
193
-
194
-
195
-
196
-
197
-
198
-
199
-
200
-
201
-
202
-
203
-
204
-
205
-
206
-
207
-
208
-
209
-
210
 |
 |

146
To our shareholders
The Company
The new Panamera
Financials
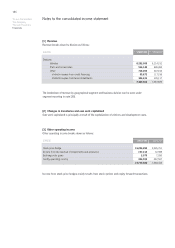
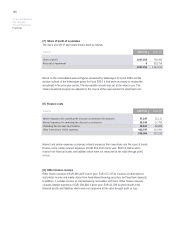
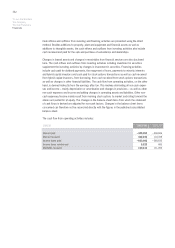
[1] Revenue
Revenue breaks down by division as follows:
The breakdown of revenue by geographical segment and business division can be seen under
segment reporting in note [35].
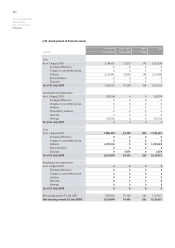
[2] Changes in inventories and own work capitalized
Own work capitalized is principally a result of the capitalization of vehicles and development costs.
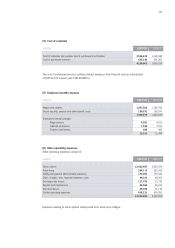
[3] Other operating income
Other operating income breaks down as follows:
Income from stock price hedges mainly results from stock options and equity forward transactions.
Notes to the consolidated income statement
EUR000 2007/08 2006/07
Divisions
Vehicles 6,232,055 6,214,192
Parts and accessories 516,144 486,490
Other 718,204 667,194
of which revenue from credit financing 35,872 117,198
of which revenue from lease installments 346,631 226,117
7,466,403 7,367,876
EUR000 2007/08 2006/07
Stock price hedge 19,256,284 6,926,751
Income from the reversal of impairments and provisions 157,214 72,988
Exchange rate gains 2,973 7,090
Sundry operating income 356,555 257,587
19,773,026 7,264,416