Porsche 2007 Annual Report Download - page 160
Download and view the complete annual report
Please find page 160 of the 2007 Porsche annual report below. You can navigate through the pages in the report by either clicking on the pages listed below, or by using the keyword search tool below to find specific information within the annual report.-
 1
1 -
2
-
3
-
4
-
5
-
6
-
7
-
8
-
9
-
10
-
11
-
12
-
13
-
14
-
15
-
16
-
17
-
18
-
19
-
20
-
21
-
22
-
23
-
24
-
25
-
26
-
27
-
28
-
29
-
30
-
31
-
32
-
33
-
34
-
35
-
36
-
37
-
38
-
39
-
40
-
41
-
42
-
43
-
44
-
45
-
46
-
47
-
48
-
49
-
50
-
51
-
52
-
53
-
54
-
55
-
56
-
57
-
58
-
59
-
60
-
61
-
62
-
63
-
64
-
65
-
66
-
67
-
68
-
69
-
70
-
71
-
72
-
73
-
74
-
75
-
76
-
77
-
78
-
79
-
80
-
81
-
82
-
83
-
84
-
85
-
86
-
87
-
88
-
89
-
90
-
91
-
92
-
93
-
94
-
95
-
96
-
97
-
98
-
99
-
100
-
101
-
102
-
103
-
104
-
105
-
106
-
107
-
108
-
109
-
110
-
111
-
112
-
113
-
114
-
115
-
116
-
117
-
118
-
119
-
120
-
121
-
122
-
123
-
124
-
125
-
126
-
127
-
128
-
129
-
130
-
131
-
132
-
133
-
134
-
135
-
136
-
137
-
138
-
139
-
140
-
141
-
142
-
143
-
144
-
145
-
146
-
147
-
148
-
149
-
 150
150 -
 151
151 -
 152
152 -
 153
153 -
 154
154 -
 155
155 -
 156
156 -
 157
157 -
 158
158 -
 159
159 -
 160
160 -
 161
161 -
 162
162 -
 163
163 -
 164
164 -
 165
165 -
 166
166 -
 167
167 -
 168
168 -
 169
169 -
 170
170 -
171
-
172
-
173
-
174
-
175
-
176
-
177
-
178
-
179
-
180
-
181
-
182
-
183
-
184
-
185
-
186
-
187
-
188
-
189
-
190
-
191
-
192
-
193
-
194
-
195
-
196
-
197
-
198
-
199
-
200
-
201
-
202
-
203
-
204
-
205
-
206
-
207
-
208
-
209
-
210
 |
 |
157
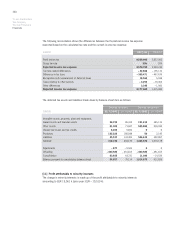
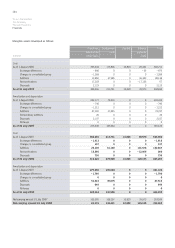
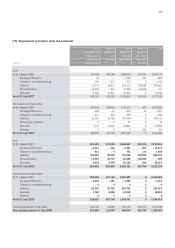
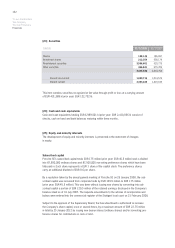
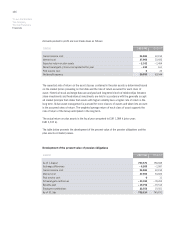
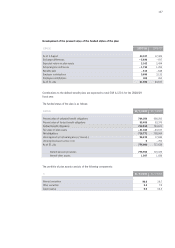
[17] Development of leased assets and of total fixed assets
EUR000
Leased
assets
Total
fixed assets
Cost
As of 1 August 2006 1,320,191 9,034,320
Exchange differences – 77,930 – 80,208
Changes to consolidated group 0– 2,426
Additions 625,724 4,519,424
Reclassifications 0 0
Disposals 535,160 618,802
As of 31 July 2007 1,332,825 12,852,308
Amortization and depreciation
As of 1 August 2006 359,541 3,353,535
Exchange differences – 20,212 – 21,973
Changes to consolidated group 0– 2,116
Additions 182,893 524,253
Extraordinary additions 043
Disposals 180,376 240,141
Write-ups 0521,150
As of 31 July 2007 341,846 3,092,451
Cost
As of 1 August 2007 1,332,825 12,852,308
Exchange differences – 153,822 – 170,806
Changes to consolidated group 01,943
Additions 573,939 2,432,031
Reclassifications 0 0
Disposals 468,961 539,881
As of 31 July 2008 1,283,981 14,575,595
Amortization and depreciation
As of 1 August 2007 341,846 3,092,451
Exchange differences – 48,373 – 57,177
Changes to consolidated group 0 0
Additions 200,041 569,372
Disposals 156,652 197,168
Write-ups 0 0
As of 31 July 2008 336,862 3,407,478
Net carrying amount 31 July 2007 990,979 9,759,857
Net carrying amount 31 July 2008 947,119 11,168,117