Stamps.com 2010 Annual Report Download - page 29
Download and view the complete annual report
Please find page 29 of the 2010 Stamps.com annual report below. You can navigate through the pages in the report by either clicking on the pages listed below, or by using the keyword search tool below to find specific information within the annual report.-
 1
1 -
2
-
3
-
4
-
5
-
6
-
7
-
8
-
9
-
10
-
11
-
12
-
13
-
14
-
15
-
16
-
17
-
18
-
 19
19 -
 20
20 -
 21
21 -
 22
22 -
 23
23 -
 24
24 -
 25
25 -
 26
26 -
 27
27 -
 28
28 -
 29
29 -
 30
30 -
 31
31 -
 32
32 -
 33
33 -
 34
34 -
 35
35 -
 36
36 -
 37
37 -
 38
38 -
 39
39 -
40
-
41
-
42
-
43
-
44
-
45
-
46
-
47
-
48
-
49
-
50
-
51
-
52
-
53
-
54
-
55
-
56
-
57
-
58
-
59
-
60
-
61
-
62
-
63
-
64
-
65
-
66
-
67
-
68
-
69
-
70
-
71
-
72
-
73
-
74
-
75
-
76
-
77
-
78
-
79
-
80
-
81
-
82
-
83
-
84
-
85
-
86
-
87
-
88
-
89
-
90
-
91
-
92
-
93
-
94
-
95
-
96
-
97
-
98
-
99
-
100
 |
 |

TABLE OF CONTENTS
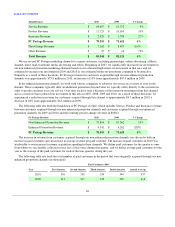
The following data should be read in conjunction with the “Management's Discussion and Analysis of Financial Condition
and Results of Operations” section and our financial statements, including the notes thereto, included elsewhere in this Report.
ITEM 6.
SELECTED FINANCIAL DATA
Year ended December 31,
2010
2009
2008
2007
2006
(in thousands, except per share data)
Statement of Operations Data:
PC postage revenue
$
78,355
$
73,623
$
73,036
$
67,017
$
63,965
PhotoStamps revenue
7,162
8,485
11,876
17,887
18,801
Other revenue
27
16
—
907
1,820
Total revenues
85,544
82,124
$
84,912
85,811
84,586
Cost and expenses:
Cost of sales
23,684
22,914
22,908
25,306
24,797
Research and development
9,420
8,699
8,425
8,260
8,817
Sales and marketing
31,174
31,735
33,538
33,115
27,793
General and administrative
14,590
12,961
15,581
12,538
11,649
Legal settlements
5,211
—
—
—
—
Income from operations
1,465
5,815
4,460
6,592
11,530
Interest and other income, net
756
916
2,918
4,461
5,096
Non
-operating asset write-off
634
—
—
—
—
Income tax expense (benefit)
(3,945
)
554
(2,786
)
387
164
Net income
$
5,532
$
6,177
$
10,164
$
10,666
$
16,462
Basic net income per share
$
0.38
$
0.38
$
0.53
$
0.51
$
0.71
Diluted net income per share
$
0.38
$
0.38
$
0.53
$
0.50
$
0.69
Weighted average shares outstanding
used in basic per-share calculation
14,529
16,238
19,081
20,815
23,233
Weighted average shares outstanding
used in diluted per-share calculation
14,685
16,369
19,345
21,194
24,032
Cash dividends declared per common
share
$
2.00
$
0.00
$
0.00
$
0.00
$
0.00
As of December 31,
2010
2009
2008
2007
2006
(in thousands)
Balance Sheet Data:
Cash, cash equivalents, restricted cash
and investments
$
35,299
$
71,745
$
74,059
$
90,823
$
106,074
Working capital
16,041
41,791
63,037
60,011
27,724
Total assets
57,442
89,258
93,258
104,953
121,550
Total stockholders’ equity
44,238
75,605
78,341
92,442
110,535
24