Stamps.com 2010 Annual Report Download - page 85
Download and view the complete annual report
Please find page 85 of the 2010 Stamps.com annual report below. You can navigate through the pages in the report by either clicking on the pages listed below, or by using the keyword search tool below to find specific information within the annual report.-
 1
1 -
2
-
3
-
4
-
5
-
6
-
7
-
8
-
9
-
10
-
11
-
12
-
13
-
14
-
15
-
16
-
17
-
18
-
19
-
20
-
21
-
22
-
23
-
24
-
25
-
26
-
27
-
28
-
29
-
30
-
31
-
32
-
33
-
34
-
35
-
36
-
37
-
38
-
39
-
40
-
41
-
42
-
43
-
44
-
45
-
46
-
47
-
48
-
49
-
50
-
51
-
52
-
53
-
54
-
55
-
56
-
57
-
58
-
59
-
60
-
61
-
62
-
63
-
64
-
65
-
66
-
67
-
68
-
69
-
70
-
71
-
72
-
73
-
74
-
 75
75 -
 76
76 -
 77
77 -
 78
78 -
 79
79 -
 80
80 -
 81
81 -
 82
82 -
 83
83 -
 84
84 -
 85
85 -
 86
86 -
 87
87 -
 88
88 -
 89
89 -
 90
90 -
 91
91 -
 92
92 -
 93
93 -
 94
94 -
 95
95 -
96
-
97
-
98
-
99
-
100
 |
 |

TABLE OF CONTENTS
STAMPS.COM INC. AND SUBSIDIARY
NOTES TO CONSOLIDATED FINANCIAL STATEMENTS
11. Employee Stock Plans – (continued)
of common stock and stock units, although “full value” awards (such as restricted stock and restricted stock units) will be
counted against the 2010 Plan’s overall limits as two shares (rather than one), while options and stock appreciation rights will be
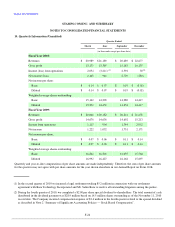
counted as one share. A summary of stock option activity is as follows (in thousands, except per share amounts):
The weighted-average fair value of stock grants for 2010, 2009 and 2008 using the Black-Scholes valuation method are as
follows:
Options
Outstanding
Weighted
Average
Exercise
Price
Number of
Options
Balance at December 31, 2007
3,091
$
16.17
Granted
528
11.36
Forfeited
(288
)
16.48
Exercised
(45
)
7.49
Balance at December 31, 2008
3,286
$
16.77
Granted
146
8.93
Forfeited
(238
)
26.54
Exercised
(18
)
6.57
Balance at December 31, 2009
3,176
$
14.38
Granted
207
11.33
Forfeited
(325
)
21.69
Exercised
(280
)
7.22
Balance at December 31, 2010
2,778
$
12.58
Weighted average exercise prices for stock options exercised in 2010 are as follows:
2010
2009
2008
Weighted-average fair value of stock options with an
exercise price equal to the market price on the grant date
$
4.71
$
4.04
$
5.28
Weighted-average fair value of stock options with an
exercise price greater than the market price on the grant
date —
—
—
Total $
4.71
$
4.04
$
5.28
2010
Weighted-average exercise price of stock options with an exercise price equal to the
market price on the grant date $
7.22
Weighted-
average exercise price of stock options with an exercise price greater than the
market price on the grant date —
Total weighted-average exercise price $
7.22
F-20