Stamps.com 2010 Annual Report Download - page 33
Download and view the complete annual report
Please find page 33 of the 2010 Stamps.com annual report below. You can navigate through the pages in the report by either clicking on the pages listed below, or by using the keyword search tool below to find specific information within the annual report.-
 1
1 -
2
-
3
-
4
-
5
-
6
-
7
-
8
-
9
-
10
-
11
-
12
-
13
-
14
-
15
-
16
-
17
-
18
-
19
-
20
-
21
-
22
-
 23
23 -
 24
24 -
 25
25 -
 26
26 -
 27
27 -
 28
28 -
 29
29 -
 30
30 -
 31
31 -
 32
32 -
 33
33 -
 34
34 -
 35
35 -
 36
36 -
 37
37 -
 38
38 -
 39
39 -
 40
40 -
 41
41 -
 42
42 -
 43
43 -
44
-
45
-
46
-
47
-
48
-
49
-
50
-
51
-
52
-
53
-
54
-
55
-
56
-
57
-
58
-
59
-
60
-
61
-
62
-
63
-
64
-
65
-
66
-
67
-
68
-
69
-
70
-
71
-
72
-
73
-
74
-
75
-
76
-
77
-
78
-
79
-
80
-
81
-
82
-
83
-
84
-
85
-
86
-
87
-
88
-
89
-
90
-
91
-
92
-
93
-
94
-
95
-
96
-
97
-
98
-
99
-
100
 |
 |

TABLE OF CONTENTS
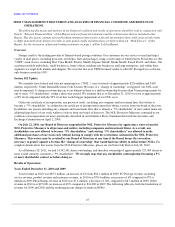
The following table sets forth the growth in paid customers and average annual revenue per paid customer for customers
originally acquired through our non-enhanced promotion channel:
For customers originally acquired through our non-enhanced promotion channels, our average annual and monthly PC
Postage revenue per paid customer in 2010 was $218.99 and $18.25 respectively, which increased by 3% compared to $211.66
and $17.64, respectively in 2009. The increase was partially attributable to an increase in average service fee revenue per paid
customer driven by having a larger number of customers on higher priced plans and increased usage of our service and partially
attributable to an increase in average store and insurance revenue per paid customer driven by increased usage of our service.
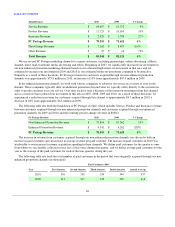
The following table sets forth our results of operations as a percentage of total revenue for the periods indicated:
Non-Enhanced Promotion Revenue
2010
2009
% Change
Average paid customers for the year (in thousands)
337
318
6
%
Average annual revenue per paid customer
$
219
$
212
3
%
Non-Enhanced Promotion Revenue ($000s)
$
73,814
$
67,362
10%
Revenue
Twelve months ended
December 31,
2010
2009
Total Revenues:
Service
75.5
%
74.7
%
Product
13.7
%
13.0
%
Insurance
2.4
%
2.0
%
PhotoStamps
8.4
%
10.3
%
Other
0.0
%
0.0
%
Total revenues
100.0
%
100.0
%
Cost of revenues:
Service
15.5
%
14.4
%
Product
5.1
%
4.9
%
Insurance
0.7
%
0.6
%
PhotoStamps
6.3
%
8.0
%
Total cost of revenues
27.7
%
27.9
%
Gross profit
72.3
%
72.1
%
Operating expenses:
Sales and marketing
36.4
%
38.6
%
Research and development
11.0
%
10.6
%
General and administrative
17.1
%
15.8
%
Legal settlements
6.1
%
0.0
%
Total operating expenses
70.6
%
65.0
%
Asset write-off
1.7
%
0.0
%
Income from operations
-
0.7
%
7.1
%
Interest and other income, net
0.9
%
1.1
%
Income before income taxes
1.9
%
8.2
%
Income taxes expense (benefit)
-
4.6
%
0.7
%
Net income
6.5
%
7.5
%