TCF Bank 2006 Annual Report Download - page 38
Download and view the complete annual report
Please find page 38 of the 2006 TCF Bank annual report below. You can navigate through the pages in the report by either clicking on the pages listed below, or by using the keyword search tool below to find specific information within the annual report.-
 1
1 -
2
-
3
-
4
-
5
-
6
-
7
-
8
-
9
-
10
-
11
-
12
-
13
-
14
-
15
-
16
-
17
-
18
-
19
-
20
-
21
-
22
-
23
-
24
-
25
-
26
-
27
-
 28
28 -
 29
29 -
 30
30 -
 31
31 -
 32
32 -
 33
33 -
 34
34 -
 35
35 -
 36
36 -
 37
37 -
 38
38 -
 39
39 -
 40
40 -
 41
41 -
 42
42 -
 43
43 -
 44
44 -
 45
45 -
 46
46 -
 47
47 -
 48
48 -
49
-
50
-
51
-
52
-
53
-
54
-
55
-
56
-
57
-
58
-
59
-
60
-
61
-
62
-
63
-
64
-
65
-
66
-
67
-
68
-
69
-
70
-
71
-
72
-
73
-
74
-
75
-
76
-
77
-
78
-
79
-
80
-
81
-
82
-
83
-
84
-
85
-
86
-
87
-
88
-
89
-
90
-
91
-
92
-
93
-
94
-
95
-
96
-
97
-
98
-
99
-
100
-
101
-
102
-
103
-
104
-
105
-
106
-
107
-
108
-
109
-
110
-
111
-
112
 |
 |

18 TCF Financial Corporation and Subsidiaries
and lines of credit secured by residential real estate proper-
ties. The leasing and equipment finance businesses consist
of TCF Equipment Finance, Inc. (“TCF Equipment Finance”),
a company that delivers equipment finance solutions to
businesses in select markets, and Winthrop Resources
Corporation (“Winthrop Resources”), a leasing company
that primarily leases technology and data processing
equipment. TCF’s leasing and equipment finance businesses
operate in all 50 states and have equipment installations
domestically and, to a limited extent, in foreign countries.
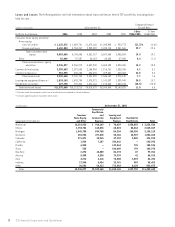
As a primarily secured lender, TCF emphasizes credit
quality over asset growth. As a result, TCF’s credit losses are
generally lower than those experienced by other banks. The
allowance for loan and lease losses, which is generally lower
as a percent of loans and leases than the average in the
banking industry, reflects the lower historical charge-offs
and management’s expectation of the risk of loss inherent
in the loan and lease portfolio. See “Consolidated Financial
Condition Analysis – Allowance for Loan and Lease Losses.”
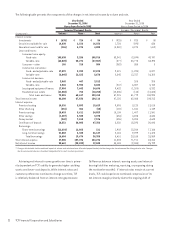
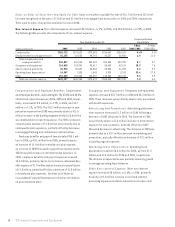
Net interest income, the difference between interest
income earned on loans and leases, securities available for
sale, investments and other interest-earning assets and
interest paid on deposits and borrowings, represented 52.3%
of TCF’s total revenue in 2006. Net interest income can change
significantly from period to period based on general levels
of interest rates, customer prepayment patterns, the mix of
interest-earning assets and the mix of interest-bearing and
non-interest bearing deposits and borrowings. TCF manages
the risk of changes in interest rates on its net interest income
through an Asset/Liability Committee and through related
interest-rate risk monitoring and management policies.
During 2006, TCF’s net interest margin declined to 4.16%
from 4.46% in 2005 and 4.54% in 2004. The declines in 2006
and 2005 were primarily due to customer preference for
lower-yielding fixed-rate loans and higher-cost market-rate
deposits largely due to a flat or inverted yield curve and
higher borrowing costs. In addition, intense price competition
on loans and deposits has contributed to the compression of
the net interest margin in 2006 and 2005. See “Quantitative
and Qualitative Disclosures About Market Risk” for further
discussion on TCF’s interest-rate risk position.
Non-interest income is a significant source of revenue
for TCF and an important factor in TCF’s results of operations.
A key driver of non-interest income is its number of checking
accounts and the related transaction activity. Increasing
fee and service charge revenues has been challenging as a
result of slower growth in deposit accounts and changing
customer behaviors. TCF is focusing on deposit account
growth to increase future fee revenue. See “Management’s
Discussion and Analysis of Financial Condition and Results
of Operations – Consolidated Income Statement Analysis –
Non-Interest Income” for additional information.
The Company’s Visa debit card program has grown signifi-
cantly since its inception in 1996. TCF is the 13th largest
issuer of Visa Classic debit cards in the United States, based
on sales volume for the three months ended September 30,
2006 as published by Visa. TCF earns interchange revenue
from customer debit card transactions.
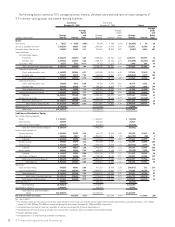
The following portions of the Management’s Discussion
and Analysis of Financial Condition and Results of Operations
focus in more detail on the results of operations for 2006,
2005 and 2004 and on information about TCF’s balance
sheet, credit quality, liquidity funding resources, capital
and other matters.
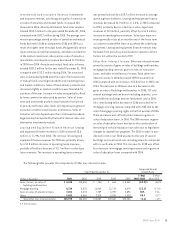
Results of Operations
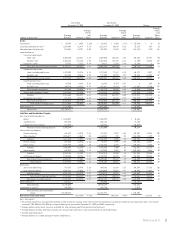
Performance Summary TCF reported diluted earnings
per common share of $1.90 for 2006, compared with $2.00
for 2005 and $1.86 for 2004. Net income was $244.9 million
for 2006, compared with $265.1 million for 2005 and $255
million for 2004. For 2006, net income included $5.8 million
in pre-tax gains on sales of buildings and mortgage servicing
rights and $6.1 million of reductions of income tax expense
for a combined after-tax impact of eight cents per diluted
share. For 2005, net income included $24.3 million in pre-tax
gains on sales of buildings and mortgage-backed securities,
a $3.3 million pre-tax commercial loan recovery and $14 mil-
lion of reductions in income tax expense for a combined
after-tax impact of 25 cents per diluted share. Return on
average assets was 1.74% in 2006, compared with 2.08% in
2005 and 2.15% in 2004. Return on average common equity
was 24.37% in 2006, compared with 28.03% in 2005 and
27.02% in 2004. The effective income tax rate for 2006 was
31.41%, compared with 30.30% in 2005 and 33.68% in 2004.