TCF Bank 2006 Annual Report Download - page 5
Download and view the complete annual report
Please find page 5 of the 2006 TCF Bank annual report below. You can navigate through the pages in the report by either clicking on the pages listed below, or by using the keyword search tool below to find specific information within the annual report.-
 1
1 -
 2
2 -
 3
3 -
 4
4 -
 5
5 -
 6
6 -
 7
7 -
 8
8 -
 9
9 -
 10
10 -
 11
11 -
 12
12 -
 13
13 -
 14
14 -
 15
15 -
 16
16 -
17
-
18
-
19
-
20
-
21
-
22
-
23
-
24
-
25
-
26
-
27
-
28
-
29
-
30
-
31
-
32
-
33
-
34
-
35
-
36
-
37
-
38
-
39
-
40
-
41
-
42
-
43
-
44
-
45
-
46
-
47
-
48
-
49
-
50
-
51
-
52
-
53
-
54
-
55
-
56
-
57
-
58
-
59
-
60
-
61
-
62
-
63
-
64
-
65
-
66
-
67
-
68
-
69
-
70
-
71
-
72
-
73
-
74
-
75
-
76
-
77
-
78
-
79
-
80
-
81
-
82
-
83
-
84
-
85
-
86
-
87
-
88
-
89
-
90
-
91
-
92
-
93
-
94
-
95
-
96
-
97
-
98
-
99
-
100
-
101
-
102
-
103
-
104
-
105
-
106
-
107
-
108
-
109
-
110
-
111
-
112
 |
 |
residential real estate. TCF’s secured lending strategy
reduces losses by providing a secondary source of repay-
ment in the event of a customer default. During 2006,
we saw the housing market soften and the Michigan
economy slow considerably. In the fourth quarter, TCF
experienced a moderate deterioration in credit quality,
especially in our Michigan consumer and commercial
loan portfolios. Overall, delinquencies remained at
acceptable levels, although they have increased from
prior periods.
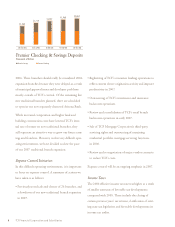
3. Fee Income and Deposit Accounts
Although deposit service charges remained a challenging
area for TCF in 2006, progress was made. Fees and
service charges increased 2.9 percent in 2006 compared
to a 4.5 percent decline in 2005. Checking account
customers continued to change their banking behavior
by writing fewer checks, using their debit card more
frequently to replace check and cash transactions, and
doing more ACH transactions.
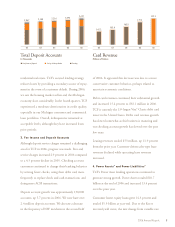
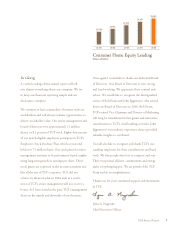
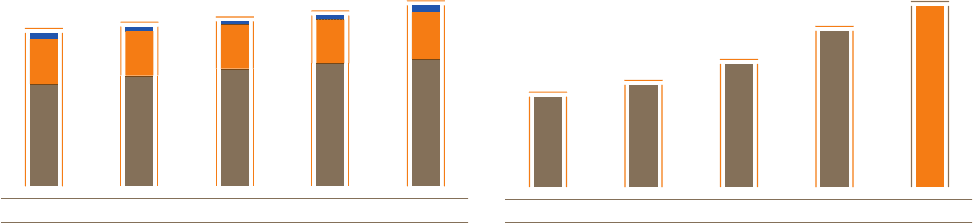
Deposit account growth was approximately 130,000
accounts, up 5.7 percent in 2006. We now have over
2.4 million deposit accounts. We also saw a decrease
in the frequency of NSF incidents in the second half
of 2006. It appeared this decrease was due to a more
conservative customer behavior, perhaps related to
uncertain economic conditions.
Debit card revenues continued their substantial growth
and increased 15.4 percent to $92.1 million in 2006.
TCF is currently the 13th largest Visa®Classic debit card
issuer in the United States. Debit card revenue growth
has slowed somewhat as this business is maturing and
our checking account growth has slowed over the past
few years.
Leasing revenues totaled $53 million, up 11.9 percent
from the prior year. Customer-driven sales-type lease
revenues declined while operating lease revenues
increased.
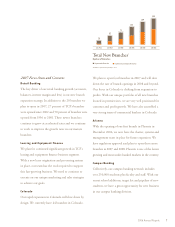
4. Power Assets®and Power Liabilities®
TCF’s Power Asset lending operations continued to
generate strong growth. Power Assets totaled $10.7
billion at the end of 2006 and increased 13.4 percent
over the prior year.
Consumer home equity loans grew 14.3 percent and
totaled $5.9 billion at year-end. Due to the flat or
inverted yield curve, the mix change from variable rate
2006 Annual Report 3
0605040302
2,427
2,296
2,216
2,150
2,067
Total Deposit Accounts
In Thousands
■ Checking
■ Savings & Money Market■ Certificates of Deposit
0605040302
$92.1
$79.8
$63.5
$53.0
$47.2
Card Revenue
Millions of Dollars