Tesco 2010 Annual Report Download - page 40
Download and view the complete annual report
Please find page 40 of the 2010 Tesco annual report below. You can navigate through the pages in the report by either clicking on the pages listed below, or by using the keyword search tool below to find specific information within the annual report.-
 1
1 -
2
-
3
-
4
-
5
-
6
-
7
-
8
-
9
-
10
-
11
-
12
-
13
-
14
-
15
-
16
-
17
-
18
-
19
-
20
-
21
-
22
-
23
-
24
-
25
-
26
-
27
-
28
-
29
-
 30
30 -
 31
31 -
 32
32 -
 33
33 -
 34
34 -
 35
35 -
 36
36 -
 37
37 -
 38
38 -
 39
39 -
 40
40 -
 41
41 -
 42
42 -
 43
43 -
 44
44 -
 45
45 -
 46
46 -
 47
47 -
 48
48 -
 49
49 -
 50
50 -
51
-
52
-
53
-
54
-
55
-
56
-
57
-
58
-
59
-
60
-
61
-
62
-
63
-
64
-
65
-
66
-
67
-
68
-
69
-
70
-
71
-
72
-
73
-
74
-
75
-
76
-
77
-
78
-
79
-
80
-
81
-
82
-
83
-
84
-
85
-
86
-
87
-
88
-
89
-
90
-
91
-
92
-
93
-
94
-
95
-
96
-
97
-
98
-
99
-
100
-
101
-
102
-
103
-
104
-
105
-
106
-
107
-
108
-
109
-
110
-
111
-
112
-
113
-
114
-
115
-
116
-
117
-
118
-
119
-
120
-
121
-
122
-
123
-
124
-
125
-
126
-
127
-
128
-
129
-
130
-
131
-
132
-
133
-
134
-
135
-
136
 |
 |

38 Tesco PLC Annual Report and Financial Statements 2010
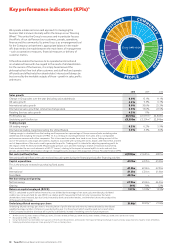
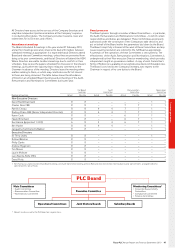
Key performance indicators (KPIs)*
We operate a balanced scorecard approach to managing the
business that is known internally within the Group as our ‘Steering
Wheel’. This unites the Group’s resources and in particular focuses
the efforts of our staff around our customers, people, operations,
finance and the community. Its prime focus is as a management tool
for the Company so that there is appropriate balance in the trade-
offs that need to be made between the main levers of management
– such as operations measures, financial measures or delivery of
customer metrics.
It therefore enables the business to be operated and monitored
on a balanced basis with due regard to the needs of all stakeholders.
For the owners of the business, it is simply based around the
philosophy that if we look after customers and staff well and operate
efficiently and effectively then shareholders’ interests will always be
best served by the inevitable outputs of those – growth in sales, profits
and returns.
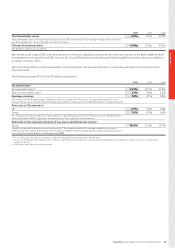
2010 2009 2008
Sales growth
Change in Group sales over the year (including value added tax) 6.8% 15.1% 11.1%
UK sales growth 4.2% 9.5% 6.7%
International sales growth 8.8% 30.6% 25.3%
International sales growth (at constant exchange rates) 6.6% 13.6% 22.5%
Retailing Services sales growth 4.2% 11% –
Profit before tax £3,176m £2,917m** £2,803m
Underlying profit before tax £3,395m £3,124m** £2,846m
Trading margin
UK trading margin 6.2% 6.2% 5.9%
International trading margin (excluding the United States) 5.3% 5.3% 5.6%
Trading margin is calculated from the trading profit expressed as a percentage of Group revenue (sales excluding value
added tax) and excluding the impact of IFRIC 13. It is a measure of profit generation from sales and is a comparable
performance measure with other companies. This is how much we made from trade in our stores, taking account of the
cost of the products sold, wages and salaries, expenses associated with running the stores, depots and head office, and the
cost of depreciation of the assets used to generate the profits. Trading profit is stated after adjusting operating profit for
the impact of IAS 19, IAS 32 and IAS 39 (principally pension costs and the marking to market of financial instruments).
It also excludes the non-cash elements of IAS 17 ‘Leases’, relating to the impact of annual uplifts in rents and rent-free
periods, and the IFRS 3 amortisation charge on intangible assets arising on the acquisition of Tesco Personal Finance (TPF).
Net cash (outflow)/inflow £(739)m £1,601m £801m
Net cash (outflow)/inflow is the cash received less cash spent during the financial period, after financing activities
Capital expenditure £3.1bn £4.7bn £3.9bn
This is the amount invested in purchasing fixed assets
UK £1.5bn £2.6bn £2.3bn
International £1.5bn £2.1bn £1.6bn
Tesco Bank £0.1bn – –
Net borrowings and gearing
Net borrowings £7.9bn £9.6bn £6.2bn
Gearing 54% 74% 52%
Return on capital employed (ROCE) 12.1% 12.8%** 12.9%‡
ROCE is calculated as profit before interest less tax divided by the average of net assets plus net debt plus dividend
creditor less net assets held for sale. ROCE is a relative profit measurement that not only incorporates the funds
shareholders have invested, but also funds invested by banks and other lenders, and therefore shows the productivity
of the assets of the Group.
Underlying diluted earnings per share 31.66p§28.87p** 27.02p
Underlying diluted earnings per share is the calculation of profit after tax and minority interest divided by the diluted
weighted average number of shares in issue during the year. It is the amount which could be paid out on each share
if the Company decided to distribute all its profits as dividends instead of retaining some for future expansion.
* All KPIs are for 52 weeks ended 27 February 2010, 53 weeks ended 28 February 2009 and 52 weeks ended 23 February 2008 unless otherwise stated.
** Restated for IFRS 2 and IFRIC 13.
‡ Using ‘normalised’ tax rate before start-up costs in the US and Tesco Direct, and excludes the impact of foreign exchange in equity and our acquisition of a majority share of Dobbies.
§ Underlying diluted earnings per share grew by 9.7% on a statutory basis.
C
O
M
M
U
N
I
T
Y
C
U
S
T
O
M
E
R
THE STAFF
ARE GREAT
I DON’T QUEUE
THE PRICES
ARE GOOD
I CAN GET
WHAT I WANT
THE AISLES
ARE CLEAR
EARN LIFETIME
LOYALTY
O
P
E
R
A
T
I
O
N
S
WE ALWAYS SAVE
TIME AND MONEY
WE KNOW
HOW VITAL OUR
JOBS ARE
WE MAKE OUR
JOBS EASIER
TO DO
WE DELIVER
CONSISTENTLY
EVERY DAY
WE TRY TO
GET IT RIGHT
FIRST TIME
CREATING
GOOD JOBS AND
CAREERS
GIVING CUSTOMERS
HEALTHY CHOICES
CARING FOR THE
ENVIRONMENT
BUYING AND SELLING OUR
PRODUCTS RESPONSIBLY
ACTIVELY
SUPPORTING LOCAL
COMMUNITIES
P
E
O
P
L
E
AN OPPORTUNITY
TO GET ON
AN INTERESTING
JOB
A MANAGER WHO
HELPS ME
TO BE TREATED
WITH RESPECT
MANAGE OUR
INVESTMENT
MAXIMISE
PROFIT
GROW SALES
F
I
N
A
N
C
E
T
R
E
A
T
P
E
O
P
L
E
H
O
W
W
E
L
I
K
E
T
O
B
E
T
R
E
A
T
E
D
N
O
-
O
N
E
T
R
I
E
S
H
A
R
D
E
R
F
O
R
C
U
S
T
O
M
E
R
S