Tesco 2010 Annual Report Download - page 85
Download and view the complete annual report
Please find page 85 of the 2010 Tesco annual report below. You can navigate through the pages in the report by either clicking on the pages listed below, or by using the keyword search tool below to find specific information within the annual report.-
 1
1 -
2
-
3
-
4
-
5
-
6
-
7
-
8
-
9
-
10
-
11
-
12
-
13
-
14
-
15
-
16
-
17
-
18
-
19
-
20
-
21
-
22
-
23
-
24
-
25
-
26
-
27
-
28
-
29
-
30
-
31
-
32
-
33
-
34
-
35
-
36
-
37
-
38
-
39
-
40
-
41
-
42
-
43
-
44
-
45
-
46
-
47
-
48
-
49
-
50
-
51
-
52
-
53
-
54
-
55
-
56
-
57
-
58
-
59
-
60
-
61
-
62
-
63
-
64
-
65
-
66
-
67
-
68
-
69
-
70
-
71
-
72
-
73
-
74
-
 75
75 -
 76
76 -
 77
77 -
 78
78 -
 79
79 -
 80
80 -
 81
81 -
 82
82 -
 83
83 -
 84
84 -
 85
85 -
 86
86 -
 87
87 -
 88
88 -
 89
89 -
 90
90 -
 91
91 -
 92
92 -
 93
93 -
 94
94 -
 95
95 -
96
-
97
-
98
-
99
-
100
-
101
-
102
-
103
-
104
-
105
-
106
-
107
-
108
-
109
-
110
-
111
-
112
-
113
-
114
-
115
-
116
-
117
-
118
-
119
-
120
-
121
-
122
-
123
-
124
-
125
-
126
-
127
-
128
-
129
-
130
-
131
-
132
-
133
-
134
-
135
-
136
 |
 |

Financial statements
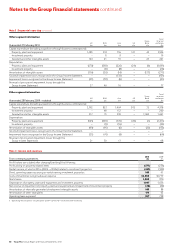
Note 2 Segmental reporting continued
Total
Tesco at actual
Year ended 28 February 2009 UK ROE Asia US Bank exchange
At actual exchange rates £m £m £m £m £m £m
Continuing operations
Sales inc. VAT (excluding IFRIC 13) 41,357 10,120 7,578 208 163 59,426
Revenue (excluding IFRIC 13) 38,028 8,862 7,068 206 163 54,327
Effect of IFRIC 13 (378) (31) (20) – – (429)
Revenue 37,650 8,831 7,048 206 163 53,898
Trading profit/(loss) 2,309 496 355 (142) 68 3,086
Trading margin* 6.1% 5.6% 5.0% (68.9%) 41.7% 5.7%
* Trading margin is based on revenue excluding IFRIC 13.
Reconciliation of trading profit to profit before tax
2010 2009
Restated
£m £m
Trading profit for reportable segments 3,412 3,086
Adjustments for:
Profit arising on property-related items 377 236
IAS 19 Non-cash Group Income Statement charge for pensions 24 (52)
IAS 17 ‘Leases’ – impact of annual uplifts in rent and rent-free periods (51) (36)
IFRS 3 ‘Business Combinations’ – amortisation charge from intangible assets arising on acquisition (127) (32)
IFRIC 13 ‘Customer Loyalty Programmes’ – fair value of awards (14) (33)
Exceptional items:
IAS 36 Impairment of goodwill arising on acquisitions (131) –
Restructuring costs (33) –
Operating profit 3,457 3,169
Share of post-tax profit from joint ventures and associates 33 110
Finance income 265 116
Finance costs (579) (478)
Profit before tax 3,176 2,917
Taxation (840) (779)
Profit for the year 2,336 2,138
Segment assets
Total
Tesco Other/ at actual
UK ROE Asia US Bank unallocated exchange
At 27 February 2010 £m £m £m £m £m £m £m
Total segment non-current assets 14,741 6,588 7,115 790 3,738 1,286 34,258
Total segment non-current assets includes:
Investments in joint ventures and associates 55 – 95 – 2 – 152
Total
Tesco Other/ at actual
UK ROE Asia US Bank unallocated exchange
At 28 February 2009 £m £m £m £m £m £m £m
Total segment non-current assets 15,441 5,748 5,883 721 2,748 1,467 32,008
Restatement of acquisitions through
business combinations – – 14 – 63 – 77
Total segment non-current assets – restated 15,441 5,748 5,897 721 2,811 1,467 32,085
Total segment non-current assets includes:
Investments in joint ventures and associates 49 – 13 – – – 62
Tesco PLC Annual Report and Financial Statements 2010 83