Tesco 2010 Annual Report Download - page 91
Download and view the complete annual report
Please find page 91 of the 2010 Tesco annual report below. You can navigate through the pages in the report by either clicking on the pages listed below, or by using the keyword search tool below to find specific information within the annual report.-
 1
1 -
2
-
3
-
4
-
5
-
6
-
7
-
8
-
9
-
10
-
11
-
12
-
13
-
14
-
15
-
16
-
17
-
18
-
19
-
20
-
21
-
22
-
23
-
24
-
25
-
26
-
27
-
28
-
29
-
30
-
31
-
32
-
33
-
34
-
35
-
36
-
37
-
38
-
39
-
40
-
41
-
42
-
43
-
44
-
45
-
46
-
47
-
48
-
49
-
50
-
51
-
52
-
53
-
54
-
55
-
56
-
57
-
58
-
59
-
60
-
61
-
62
-
63
-
64
-
65
-
66
-
67
-
68
-
69
-
70
-
71
-
72
-
73
-
74
-
75
-
76
-
77
-
78
-
79
-
80
-
 81
81 -
 82
82 -
 83
83 -
 84
84 -
 85
85 -
 86
86 -
 87
87 -
 88
88 -
 89
89 -
 90
90 -
 91
91 -
 92
92 -
 93
93 -
 94
94 -
 95
95 -
 96
96 -
 97
97 -
 98
98 -
 99
99 -
 100
100 -
 101
101 -
102
-
103
-
104
-
105
-
106
-
107
-
108
-
109
-
110
-
111
-
112
-
113
-
114
-
115
-
116
-
117
-
118
-
119
-
120
-
121
-
122
-
123
-
124
-
125
-
126
-
127
-
128
-
129
-
130
-
131
-
132
-
133
-
134
-
135
-
136
 |
 |

Financial statements
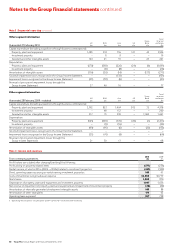
Note 8 Dividends
52 weeks ended 53 weeks ended
27 February 2010 28 February 2009
pence/share £m pence/share £m
Amounts recognised as distributions to owners in the year:
Final dividend for the prior financial year 8.39 660 7.70 603
Interim dividend for the current financial year 3.89 308 3.57 280
12.28 968 11.27 883
Proposed final dividend for the current financial year 9.16 731 8.39 662
The proposed final dividend was approved by the Board of Directors on 19 April 2010 and is subject to the approval of shareholders at the Annual
General Meeting. The proposed dividend has not been included as a liability as at 27 February 2010, in accordance with IAS 10 ‘Events After the
Balance Sheet Date’. It will be paid on 9 July 2010 to shareholders who are on the register of members on 1 May 2010.
Note 9 Earnings per share and diluted earnings per share
Basic earnings per share amounts are calculated by dividing the profit attributable to owners of the parent by the weighted average number of ordinary
shares in issue during the year.
Diluted earnings per share amounts are calculated by dividing the profit attributable to owners of the parent by the weighted average number of
ordinary shares in issue during the year (adjusted for the effects of potentially dilutive options).
The dilution effect is calculated on the full exercise of all potentially dilutive ordinary share options granted by the Group, including performance-based
options which the Group considers to have been earned.
All operations are continuing for the years presented.
52 weeks ended 53 weeks ended
27 February 2010 28 February 2009
Restated
Potentially Potentially
dilutive dilutive
Basic share options Diluted Basic share options Diluted
Profit (£m) 2,327 – 2,327 2,133 – 2,133
Weighted average number of shares (millions) 7,933 39 7,972 7,859 53 7,912
Earnings per share (pence) 29.33 (0.14) 29.19 27.14 (0.18) 26.96
There have been no transactions involving ordinary shares between the reporting date and the date of approval of these financial statements which
would significantly change the earnings per share calculations shown above.
Reconciliation of non-GAAP underlying diluted earnings per share
52 weeks ended 53 weeks ended
27 February 2010 28 February 2009
Restated
£m pence/share £m pence/share
Profit 2,327 29.19 2,133 26.96
Adjustments for:
IAS 32 and IAS 39 ‘Financial Instruments’ – fair value remeasurements (151) (1.90) 88 1.11
Total IAS 19 Non-cash Group Income Statement charge for pensions 24 0.30 27 0.34
IAS 17 ‘Leases’ – impact of annual uplifts in rent and rent-free periods 41 0.52 27 0.34
IFRS 3 Amortisation charge from intangible assets arising on acquisition 127 1.59 32 0.41
IFRIC 13 ‘Customer Loyalty Programmes’ – fair value of awards 14 0.18 33 0.41
Exceptional items:
IAS 36 Impairment of goodwill arising on acquisitions 131 1.64 – –
Restructuring costs 33 0.41 – –
Tax effect of adjustments at the effective rate of tax (2010 – 25.4%*; 2009 – 26.7%) (22) (0.27) (56) (0.70)
Underlying earnings from operations 2,524 31.66 2,284 28.87
* The effective tax rate of 25.4% excludes the adjustment for goodwill impairment.
Tesco PLC Annual Report and Financial Statements 2010 89