TomTom 2008 Annual Report Download - page 19
Download and view the complete annual report
Please find page 19 of the 2008 TomTom annual report below. You can navigate through the pages in the report by either clicking on the pages listed below, or by using the keyword search tool below to find specific information within the annual report.-
 1
1 -
2
-
3
-
4
-
5
-
6
-
7
-
8
-
 9
9 -
 10
10 -
 11
11 -
 12
12 -
 13
13 -
 14
14 -
 15
15 -
 16
16 -
 17
17 -
 18
18 -
 19
19 -
 20
20 -
 21
21 -
 22
22 -
 23
23 -
 24
24 -
 25
25 -
 26
26 -
 27
27 -
 28
28 -
 29
29 -
30
-
31
-
32
-
33
-
34
-
35
-
36
-
37
-
38
-
39
-
40
-
41
-
42
-
43
-
44
-
45
-
46
-
47
-
48
-
49
-
50
-
51
-
52
-
53
-
54
-
55
-
56
-
57
-
58
-
59
-
60
-
61
-
62
-
63
-
64
-
65
-
66
-
67
-
68
-
69
-
70
-
71
-
72
-
73
-
74
-
75
-
76
-
77
-
78
-
79
-
80
-
81
-
82
-
83
-
84
 |
 |

/ 17
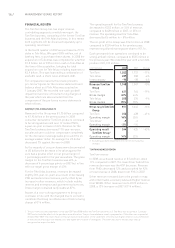
Marketing expenses
Marketing expenses include advertising expenses
and any expenses directly attributable to our
marketing teams, including personnel expenses,
worldwide. Total marketing expenses decreased 5%
to €130.6 million in 2008, down from €137.3 million
in 2007.
SG&A expenses
SG&A expenses include the costs of personnel
engaged in sales activities, customer support, IT,
legal, office and other general expenses. SG&A
expenses increased by 35% to €144.9 million in 2008,
up from €107.6 million in 2007, mainly as a result
of the increase in staff and professional services.
TELE ATLAS BUSINESS REVIEW
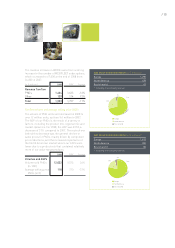
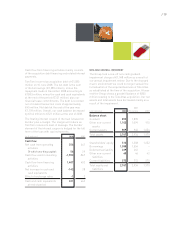
Tele Atlas revenue
In 2008, we achieved a revenue of €289 million,
down 6% on 2007. The main driver behind this
revenue decrease was decreasing revenue from
PNDs and automotive & data, partly offset by
increasing other revenues, which include mobile,
internet and enterprise and governmental services.
(in € millions) 2008 2007 Change
Revenue Tele Atlas
PNDs 151 170 -11%
Automotive & data 55 66 -17%
Other 84 72 17%
Total 289 308 -6%
Tele Atlas geography
In 2008, Tele Atlas generated revenue in EMEA,
North America and Asia Pacific. EMEA sales were
down year-on-year however this was partly
compensated by increased sales in North America
and the rest of world. The proportion of sales outside
EMEA rose to 34% in 2008, up from 30% in 2007.
North American revenue increased to €81 million in
2008 up from €79 million in 2007. Revenue in North
America represented 28% of Tele Atlas revenue, up
from 26% in the previous year. In EMEA, revenue
decreased by 11% to €192 million, down from
€217 million.
(in € millions) 2008 2007 Change
Tele Atlas revenues
per region
Europe 192 217 -11%
North America 81 79 3%
Rest of world 16 12 30%
Total 289 308 -6%
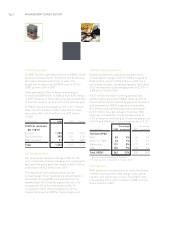
Tele Atlas gross result
The gross margin for Tele Atlas remained fairly
stable at 87% (2007: 90%).
Tele Atlas operating expenses
Operating expenses, excluding employee stock
compensation charges, in 2008 decreased to
€251 million, down from €261 million in 2007. As a
percentage of sales, operating expenses (excluding
SOC) increased by 2.0 percentage points to 86.9%
in 2008 from 84.9% in 2007.
The €10 million decrease in total operating
expenses is explained by a decrease of €7 million
in SG&A and a decrease of €5 million in marketing
spend. As a percentage of revenue, R&D expenses
increased by 2.5 percentage points to 34.7% of
revenue, SG&A decreased by 0.7 percentage points
to 27.7% and marketing expenses decreased by 1.2
percentage points to 8.4%.
Percentage Percentage
(in € millions) 2008 of revenue 2007 of revenue
Tele Atlas OPEX
R&D 100 35% 99 32%
Amort. of T&D146 16% 45 15%
Marketing 24 8% 30 10%
SGA 80 28% 88 28%
Total OPEX2251 87% 261 85%
1 Amortisation of technology & database
2 Excluding stock compensation charges (SOC)
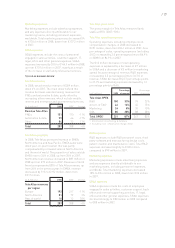
R&D expenses
R&D expenses include R&D personnel costs, third
party software and manufacturing design costs,
patent creation and maintenance costs. Total R&D
expenses increased slightly to €100 million
compared to €99 million in 2007.
Marketing expenses
Marketing expenses include advertising expenses
and any expenses directly attributable to our
marketing teams, including personnel expenses,
worldwide. Total marketing expenses decreased
18% to €24 million in 2008, down from €30 million
in 2007.
SG&A expenses
SG&A expenses include the costs of employees
engaged in sales activities, customer support, back
office and internal supporting activities, IT, legal,
office and other general expenses. SG&A expenses
declined strongly to €80 million in 2008 compared
to €88 million in 2007.