TomTom 2008 Annual Report Download - page 64
Download and view the complete annual report
Please find page 64 of the 2008 TomTom annual report below. You can navigate through the pages in the report by either clicking on the pages listed below, or by using the keyword search tool below to find specific information within the annual report.-
 1
1 -
2
-
3
-
4
-
5
-
6
-
7
-
8
-
9
-
10
-
11
-
12
-
13
-
14
-
15
-
16
-
17
-
18
-
19
-
20
-
21
-
22
-
23
-
24
-
25
-
26
-
27
-
28
-
29
-
30
-
31
-
32
-
33
-
34
-
35
-
36
-
37
-
38
-
39
-
40
-
41
-
42
-
43
-
44
-
45
-
46
-
47
-
48
-
49
-
50
-
51
-
52
-
53
-
 54
54 -
 55
55 -
 56
56 -
 57
57 -
 58
58 -
 59
59 -
 60
60 -
 61
61 -
 62
62 -
 63
63 -
 64
64 -
 65
65 -
 66
66 -
 67
67 -
 68
68 -
 69
69 -
 70
70 -
 71
71 -
 72
72 -
 73
73 -
 74
74 -
75
-
76
-
77
-
78
-
79
-
80
-
81
-
82
-
83
-
84
 |
 |

62 / NOTES TO THE CONSOLIDATED FINANCIAL STATEMENTS
OF TOMTOM NV
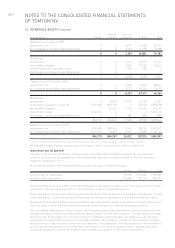
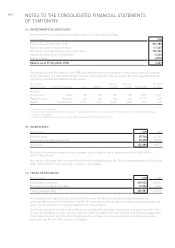
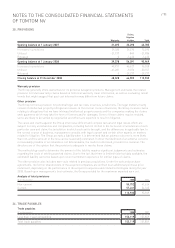
12. INTANGIBLE ASSETS (continued)
Database Internally
(€ in thousands) Goodwill and tools generated Other1Total
Balance as at 1 January 2007
Investment cost 004,099 51,052 55,151
Accumulated amortisation and impairment 00-1,740 -14,228 -15,968
002,359 36,824 39,183
Movements
Investments 007,216 26,555 33,771
Amortisation charges 00-1,533 -15,078 -16,611
Transferred within intangible assets 00385 -385 0
Net foreign currency exchange differences 00011
006,068 11,093 17,161
Balance as at 31 December 2007
Investment cost 0011,700 77,223 88,923
Accumulated amortisation and impairment 00-3,273 -29,306 -32,579
008,427 47,917 56,344
Movements
Investments 0 8,007 20,762 23,152 51,921
Acquisition of subsidiary (note 29) 1,902,489 872,909 0 83,600 2,858,998
Amortisation charges 0 -26,649 -4,159 -24,606 -55,414
Impairment charge -1,047,776 000-1,047,776
Net foreign currency exchange differences 00982 852 1,834
854,713 854,267 17,585 82,998 1,809,563
Balance as at 31 December 2008
Investment cost 1,902,489 880,916 32,462 184,204 3,000,071
Accumulated amortisation and impairment -1,047,776 -26,649 -6,450 -53,289 -1,134,164
854,713 854,267 26,012 130,915 1,865,907
1 Other intangible assets include technology and previously unrecognised customer relationships, brand name and software.
All intangible assets besides goodwill have finite useful lives. Goodwill has an indefinite useful life.
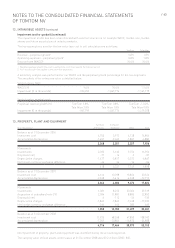
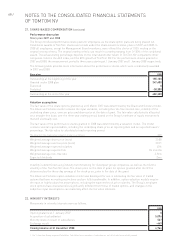
Impairment test for goodwill
Goodwill is allocated to the Group’s cash generating units (CGUs) identified according to the core business
activities as monitored by management. Cash generating units are currently the same as the two operating
segments disclosed in note 5.
An operating segment-level summary of the goodwill allocation is presented below.
TomTom Tele Atlas Total
Goodwill before impairment 710,584 1,191,905 1,902,489
Goodwill after impairment 710,584 144,129 854,713
The recoverable amount of a CGU is determined based on the higher of value in use or fair value less cost to sell
calculations. The fair value less costs to sell resulted in a higher recoverable amount.
These calculations use post-tax cash flow projections based on financial forecasts approved by management covering
a four year period. Cash flows beyond the four-year period are extrapolated using the estimated growth rates.
Management determined budget revenues based on past performance and its expectation of market development.
Discount rates used are post tax and reflect specific risks relating to the relevant operating segments.
Due to a rapidly weakening economic climate, the Group has lowered the expectations on future revenues for its
navigation products and services which have a material impact on Tele Atlas revenues. This has resulted in lower
projected cash flows leading to a revision in forecast information expected when Tele Atlas was acquired and a
subsequent an impairment charge in the Tele Atlas goodwill. The strategic rationale for the acquisition remains
valid and in tact in that superior content and cost efficiency will expand the Tele Atlas presence in world markets
as well as providing benefits to users through new features, more regular updates, faster coverage expansion,
enhanced integration of customer feedback and increasing our position in the automotive market.