Wells Fargo 2012 Annual Report Download - page 162
Download and view the complete annual report
Please find page 162 of the 2012 Wells Fargo annual report below. You can navigate through the pages in the report by either clicking on the pages listed below, or by using the keyword search tool below to find specific information within the annual report.-
 1
1 -
2
-
3
-
4
-
5
-
6
-
7
-
8
-
9
-
10
-
11
-
12
-
13
-
14
-
15
-
16
-
17
-
18
-
19
-
20
-
21
-
22
-
23
-
24
-
25
-
26
-
27
-
28
-
29
-
30
-
31
-
32
-
33
-
34
-
35
-
36
-
37
-
38
-
39
-
40
-
41
-
42
-
43
-
44
-
45
-
46
-
47
-
48
-
49
-
50
-
51
-
52
-
53
-
54
-
55
-
56
-
57
-
58
-
59
-
60
-
61
-
62
-
63
-
64
-
65
-
66
-
67
-
68
-
69
-
70
-
71
-
72
-
73
-
74
-
75
-
76
-
77
-
78
-
79
-
80
-
81
-
82
-
83
-
84
-
85
-
86
-
87
-
88
-
89
-
90
-
91
-
92
-
93
-
94
-
95
-
96
-
97
-
98
-
99
-
100
-
101
-
102
-
103
-
104
-
105
-
106
-
107
-
108
-
109
-
110
-
111
-
112
-
113
-
114
-
115
-
116
-
117
-
118
-
119
-
120
-
121
-
122
-
123
-
124
-
125
-
126
-
127
-
128
-
129
-
130
-
131
-
132
-
133
-
134
-
135
-
136
-
137
-
138
-
139
-
140
-
141
-
142
-
143
-
144
-
145
-
146
-
147
-
148
-
149
-
150
-
151
-
 152
152 -
 153
153 -
 154
154 -
 155
155 -
 156
156 -
 157
157 -
 158
158 -
 159
159 -
 160
160 -
 161
161 -
 162
162 -
 163
163 -
 164
164 -
 165
165 -
 166
166 -
 167
167 -
 168
168 -
 169
169 -
 170
170 -
 171
171 -
 172
172 -
173
-
174
-
175
-
176
-
177
-
178
-
179
-
180
-
181
-
182
-
183
-
184
-
185
-
186
-
187
-
188
-
189
-
190
-
191
-
192
-
193
-
194
-
195
-
196
-
197
-
198
-
199
-
200
-
201
-
202
-
203
-
204
-
205
-
206
-
207
-
208
-
209
-
210
-
211
-
212
-
213
-
214
-
215
-
216
-
217
-
218
-
219
-
220
-
221
-
222
-
223
-
224
-
225
-
226
-
227
-
228
-
229
-
230
-
231
-
232
-
233
-
234
-
235
-
236
-
237
-
238
-
239
-
240
-
241
-
242
-
243
-
244
-
245
-
246
-
247
-
248
-
249
-
250
-
251
-
252
 |
 |

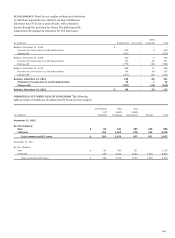
Note 6: Loans and Allowance for Credit Losses (continued)
IMPAIRED LOANS The table below summarizes key information
for impaired loans. Our impaired loans predominantly include
loans on nonaccrual status in the commercial portfolio segment
and loans modified in a TDR, whether on accrual or nonaccrual
status. These impaired loans generally have estimated losses
which are included in the allowance for credit losses. Impaired
loans exclude PCI loans. Based on clarifying guidance from the
Securities and Exchange Commission (SEC) received in
December 2011, we now classify trial modifications as TDRs at
the beginning of the trial period. The table below includes trial
modifications that totaled $705 million at December 31, 2012,
and $651 million at December 31, 2011.
Recorded investment
Impaired loans
Unpaid with related Related
principal Impaired allowance for allowance for
(in millions) balance loans credit losses credit losses
December 31, 2012
Commercial:
Commercial and industrial $ 3,331 2,086 2,086 353
Real estate mortgage 5,766 4,673 4,537 1,025
Real estate construction 1,975 1,345 1,345 276
Lease financing 54 39 39 11
Foreign 109 43 43 9
Total commercial (1) 11,235 8,186 8,050 1,674
Consumer:
Real estate 1-4 family first mortgage 21,293 18,472 15,224 3,074
Real estate 1-4 family junior lien mortgage 2,855 2,483 2,070 859
Credit card 531 531 531 244
Other revolving credit and installment 341 340 340 33
Total consumer 25,020 21,826 18,165 4,210
Total impaired loans (excluding PCI) $ 36,255 30,012 26,215 5,884
December 31, 2011
Commercial:
Commercial and industrial $ 7,191 3,072 3,018 501
Real estate mortgage 7,490 5,114 4,637 1,133
Real estate construction 4,733 2,281 2,281 470
Lease financing 127 68 68 21
Foreign 185 31 31 8
Total commercial (1) 19,726 10,566 10,035 2,133
Consumer:
Real estate 1-4 family first mortgage 16,494 14,486 13,909 3,380
Real estate 1-4 family junior lien mortgage 2,232 2,079 2,079 784
Credit card 593 593 593 339
Other revolving credit and installment 287 286 274 42
Total consumer 19,606 17,444 16,855 4,545
Total impaired loans (excluding PCI) $ 39,332 28,010 26,890 6,678
(1) The unpaid principal balance for commercial loans at December 31, 2011, includes $2.5 billion of commercial and industrial, $1.1 billion of real estate mortgage, $1.8 billion
of real estate construction and $157 million of lease financing and foreign loans that have been fully charged off and therefore have no recorded investment. The unpaid
principal balance for loans with no recorded investment has been excluded from the amounts disclosed at December 31, 2012.
160