Wells Fargo 2012 Annual Report Download - page 174
Download and view the complete annual report
Please find page 174 of the 2012 Wells Fargo annual report below. You can navigate through the pages in the report by either clicking on the pages listed below, or by using the keyword search tool below to find specific information within the annual report.-
 1
1 -
2
-
3
-
4
-
5
-
6
-
7
-
8
-
9
-
10
-
11
-
12
-
13
-
14
-
15
-
16
-
17
-
18
-
19
-
20
-
21
-
22
-
23
-
24
-
25
-
26
-
27
-
28
-
29
-
30
-
31
-
32
-
33
-
34
-
35
-
36
-
37
-
38
-
39
-
40
-
41
-
42
-
43
-
44
-
45
-
46
-
47
-
48
-
49
-
50
-
51
-
52
-
53
-
54
-
55
-
56
-
57
-
58
-
59
-
60
-
61
-
62
-
63
-
64
-
65
-
66
-
67
-
68
-
69
-
70
-
71
-
72
-
73
-
74
-
75
-
76
-
77
-
78
-
79
-
80
-
81
-
82
-
83
-
84
-
85
-
86
-
87
-
88
-
89
-
90
-
91
-
92
-
93
-
94
-
95
-
96
-
97
-
98
-
99
-
100
-
101
-
102
-
103
-
104
-
105
-
106
-
107
-
108
-
109
-
110
-
111
-
112
-
113
-
114
-
115
-
116
-
117
-
118
-
119
-
120
-
121
-
122
-
123
-
124
-
125
-
126
-
127
-
128
-
129
-
130
-
131
-
132
-
133
-
134
-
135
-
136
-
137
-
138
-
139
-
140
-
141
-
142
-
143
-
144
-
145
-
146
-
147
-
148
-
149
-
150
-
151
-
152
-
153
-
154
-
155
-
156
-
157
-
158
-
159
-
160
-
161
-
162
-
163
-
 164
164 -
 165
165 -
 166
166 -
 167
167 -
 168
168 -
 169
169 -
 170
170 -
 171
171 -
 172
172 -
 173
173 -
 174
174 -
 175
175 -
 176
176 -
 177
177 -
 178
178 -
 179
179 -
 180
180 -
 181
181 -
 182
182 -
 183
183 -
 184
184 -
185
-
186
-
187
-
188
-
189
-
190
-
191
-
192
-
193
-
194
-
195
-
196
-
197
-
198
-
199
-
200
-
201
-
202
-
203
-
204
-
205
-
206
-
207
-
208
-
209
-
210
-
211
-
212
-
213
-
214
-
215
-
216
-
217
-
218
-
219
-
220
-
221
-
222
-
223
-
224
-
225
-
226
-
227
-
228
-
229
-
230
-
231
-
232
-
233
-
234
-
235
-
236
-
237
-
238
-
239
-
240
-
241
-
242
-
243
-
244
-
245
-
246
-
247
-
248
-
249
-
250
-
251
-
252
 |
 |

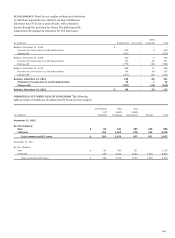
Note 8: Securitizations and Variable Interest Entities (continued)
(continued from previous page)
Other
Total Debt and commitments
VIE equity Servicing and Net
(in millions) assets interests (1) assets Derivatives guarantees assets
December 31, 2011
Carrying value - asset (liability)
Residential mortgage loan securitizations:
Conforming $ 1,135,629 4,682 11,070 - (975) 14,777
Other/nonconforming 61,461 2,460 353 1 (48) 2,766
Commercial mortgage securitizations 179,007 7,063 623 349 - 8,035
Collateralized debt obligations:
Debt securities 11,240 1,107 - 193 - 1,300
Loans (2) 9,757 9,511 - - - 9,511
Asset-based finance structures 9,606 6,942 - (130) - 6,812
Tax credit structures 19,257 4,119 - - (1,439) 2,680
Collateralized loan obligations 12,191 2,019 - 40 - 2,059
Investment funds 6,318 - - - - -
Other (3) 18,717 1,896 34 190 (1) 2,119
Total $ 1,463,183 39,799 12,080 643 (2,463) 50,059
Maximum exposure to loss
Residential mortgage loan securitizations:
Conforming $ 4,682 11,070 - 3,657 19,409
Other/nonconforming 2,460 353 1 295 3,109
Commercial mortgage securitizations 7,063 623 538 - 8,224
Collateralized debt obligations:
Debt securities 1,107 - 874 - 1,981
Loans (2) 9,511 - - - 9,511
Asset-based finance structures 6,942 - 130 1,504 8,576
Tax credit structures 4,119 - - - 4,119
Collateralized loan obligations 2,019 - 41 523 2,583
Investment funds - - - 41 41
Other (3) 1,896 34 903 150 2,983
Total $ 39,799 12,080 2,487 6,170 60,536
(1) Includes total equity interests of $5.8 billion and $4.5 billion at December 31, 2012 and 2011, respectively. The December 31, 2011 equity interests balance has been
revised to include tax credit structures, which are all equity interests. Also includes debt interests in the form of both loans and securities. Excludes certain debt securities
held related to loans serviced for FNMA, FHLMC and GNMA.
(2) Represents senior loans to trusts that are collateralized by asset-backed securities. The trusts invest primarily in senior tranches from a diversified pool of primarily U.S.
asset securitizations, of which all are current, and over 83% and 88% were rated as investment grade by the primary rating agencies at December 31, 2012 and 2011,
respectively. These senior loans are accounted for at amortized cost and are subject to the Company’s allowance and credit charge-off policies.
(3) Includes structured financing, student loan securitizations, auto loan and lease securitizations and credit-linked note structures. Also contains investments in auction rate
securities (ARS) issued by VIEs that we do not sponsor and, accordingly, are unable to obtain the total assets of the entity.
172