APC 2001 Annual Report Download - page 10
Download and view the complete annual report
Please find page 10 of the 2001 APC annual report below. You can navigate through the pages in the report by either clicking on the pages listed below, or by using the keyword search tool below to find specific information within the annual report.-
 1
1 -
 2
2 -
 3
3 -
 4
4 -
 5
5 -
 6
6 -
 7
7 -
 8
8 -
 9
9 -
 10
10 -
 11
11 -
 12
12 -
 13
13 -
 14
14 -
 15
15 -
 16
16 -
 17
17 -
 18
18 -
 19
19 -
 20
20 -
 21
21 -
22
-
23
-
24
-
25
-
26
-
27
-
28
-
29
-
30
-
31
-
32
-
33
-
34
-
35
-
36
-
37
-
38
-
39
-
40
-
41
-
42
-
43
 |
 |

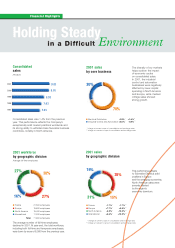
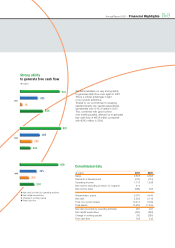
Financial Highlights
●Shareholders’ equity
●Net debt
* Including provision for Legrand shares
** Excluding provision for Legrand shares
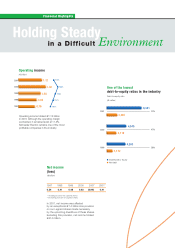
In 2001, net income was affected
by an exceptional 1.4 billion loss provision
on our Legrand shares made necessary
by the upcoming divestiture of these shares.
Excluding this provision, net income totaled
414 million.
Net income
(loss)
(€billion)
1997 1998 1999 2000 2001*2001**
0.34 0.41 0.48 0.63 (0.99) 0.41
One of the lowest
debt-to-equity ratios in the industry
Debt-to-equity ratio
(€million)
2001
2,293
8,381
2000
1999 28%
47%
27%
2,119
4,545
1,172
4,260
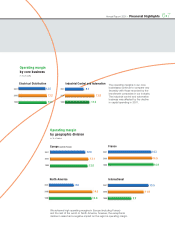
Operating income
(€billion)
1.12
1.30
2001
2000
1999
1998
1997
11.4%
13.4%
12.6%
11.2%
10.5%
Operating income totaled 1.12 billion
in 2001. Although the operating margin
contracted, it remained solid at 11.4%.
Schneider Electric remains one of the most
profitable companies in the industry.
1.06
0.85
0.76
Holding Steady
in a Difficult Environment