American Express 1998 Annual Report Download - page 30
Download and view the complete annual report
Please find page 30 of the 1998 American Express annual report below. You can navigate through the pages in the report by either clicking on the pages listed below, or by using the keyword search tool below to find specific information within the annual report.-
 1
1 -
2
-
3
-
4
-
5
-
6
-
7
-
8
-
9
-
10
-
11
-
12
-
13
-
14
-
15
-
16
-
17
-
18
-
19
-
 20
20 -
 21
21 -
 22
22 -
 23
23 -
 24
24 -
 25
25 -
 26
26 -
 27
27 -
 28
28 -
 29
29 -
 30
30 -
 31
31 -
 32
32 -
 33
33 -
 34
34 -
 35
35 -
 36
36 -
 37
37 -
 38
38 -
 39
39 -
 40
40 -
41
-
42
-
43
-
44
-
45
-
46
-
47
-
48
-
49
-
50
-
51
-
52
-
53
-
54
-
55
-
56
-
57
-
58
-
59
-
60
-
61
-
62
-
63
 |
 |

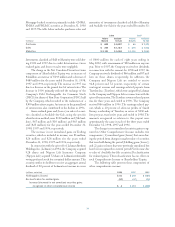
LIQUIDITY AND CAPITAL RESOURCES
SELECTED BALANCE SHEET INFORMATION
(Amounts in billions, except percentages)
December 31, 1998 1997
Investments $ 30.9 $ 30.7
Separate Account Assets $ 27.3 $ 23.2
Total Assets $ 64.6 $ 59.8
Client Contract Reserves $ 30.3 $ 30.2
Total Liabilities $ 60.6 $ 56.1
Total Shareholder’s Equity $ 4.1 $ 3.7
Return on Average Equity* 22.5% 21.8%
* Excluding the effect of SFAS No. 115.
AEFA’s total assets and liabilities rose primarily due to
growth in separate account assets as a result of market
appreciation and positive net sales for both years.
Investments comprised primarily corporate bonds and
mortgage-backed securities, including $3.4 billion and
$3.0 billion in below investment grade debt securities, in
addition to $3.8 billion in mortgage loans at December 31,
1998 and 1997. Investments are principally funded by sales
of insurance and annuities and by reinvested income.
Maturities of these investments are matched, for the most
part, with the expected future payments of insurance and
annuity obligations. Separate account assets, primarily
investments carried at market value, are for the exclusive
benefit of variable annuity and variable life insurance con-
tract holders. AEFA earns investment management and
administration fees from the related accounts.
28
RESULTS OF OPERATIONS
STATEMENTS OF INCOME
(Amounts in millions)
Years Ended December 31, 1998 1997 1996
Net Revenues:
Interest Income $854 $897 $845
Interest Expense 564 579 537
Net Interest Income 290 318 308
Travelers Cheque
Investment Income 330 331 349
Foreign Exchange Income 145 101 72
Commissions, Fees and
Other Revenues 237 374 337
Total Net Revenues 1,002 1,124 1,066
Expenses:
Human Resources 322 306 289
Other Operating Expenses 537 517 511
Provision for Losses 272 52 52
Total Expenses 1,131 875 852
Pretax (Loss)/ Income (129) 249 214
Income Tax Benefit (172) (23) (33)
Net Income $43$272 $247
American Express Bank/Travelers Cheque (AEB/TC)
1998 net income was lower than the prior year primarily
reflecting a $138 million ($213 million pretax) first quar-
ter credit loss provision related to AEB’s business in the
Asia/Pacific region, particularly Indonesia. The results for
1997 included approximately $62 million ($96 million
pretax) of increased recognition of recoveries on aban-
doned property related to the Travelers Cheque business.
These recoveries are included in Commissions, Fees and
Other Revenues.
The economic downturn in Asia contributed to
reduced net interest income and lower commissions, fees
and other revenues in 1998. In particular, net interest
income was down in 1998 due to lower corporate banking
revenues, primarily reflecting a lower overall loan portfolio
and an increase in nonperforming loans in Indonesia. These
declines were partially negated by growth in AEB’s two
businesses oriented to individuals, Private Banking and
Personal Financial Services, which resulted from greater
deposits and loans. In 1997, net interest income grew com-
pared with the prior year due to higher average balances in
loans and trading securities. Foreign exchange income rose
significantly in 1998 and 1997, reflecting strong trading
results, primarily in the Asia/Pacific region.
SELECTED STATISTICAL INFORMATION
(Amounts in billions, except percentages)
Years Ended December 31, 1998 1997 1996
American Express Bank:
Assets Managed/Administered* $ 6.2 $ 5.0 $ 4.8
Assets of Non-Consolidated
Joint Ventures $ 2.6 $ 2.4 $ 1.3
Travelers Cheque:
Sales $ 24.0 $ 25.0 $ 26.0
Average Outstandings $ 6.0 $ 5.9 $ 6.0
Average Investments $ 5.8 $ 5.6 $ 5.6
Tax Equivalent Yield 9.0% 9.2% 9.4%
* Includes assets managed by American Express Financial Advisors.
AMERICAN EXPRESS BANK/TRAVELERS CHEQUE