American Express 1998 Annual Report Download - page 47
Download and view the complete annual report
Please find page 47 of the 1998 American Express annual report below. You can navigate through the pages in the report by either clicking on the pages listed below, or by using the keyword search tool below to find specific information within the annual report.-
 1
1 -
2
-
3
-
4
-
5
-
6
-
7
-
8
-
9
-
10
-
11
-
12
-
13
-
14
-
15
-
16
-
17
-
18
-
19
-
20
-
21
-
22
-
23
-
24
-
25
-
26
-
27
-
28
-
29
-
30
-
31
-
32
-
33
-
34
-
35
-
36
-
 37
37 -
 38
38 -
 39
39 -
 40
40 -
 41
41 -
 42
42 -
 43
43 -
 44
44 -
 45
45 -
 46
46 -
 47
47 -
 48
48 -
 49
49 -
 50
50 -
 51
51 -
 52
52 -
 53
53 -
 54
54 -
 55
55 -
 56
56 -
 57
57 -
58
-
59
-
60
-
61
-
62
-
63
 |
 |

45
The Company is committed to extend credit to
certain Cardmembers as part of established lending
product agreements. Many of these are not expected to
be drawn; therefore, total unused credit available to
Cardmembers does not represent future cash require-
ments. The Company’s Charge Card products have no
preset spending limit and are not reflected in unused
credit available to Cardmembers.
The Company may require collateral to support its
loan commitments based on the creditworthiness of
the borrower.
Standby letters of credit and guarantees primarily rep-
resent conditional commitments to insure the performance
of the Company’s customers to third parties. These com-
mitments generally expire within one year.
The Company issues commercial and other letters
of credit to facilitate the short-term trade-related needs
of its clients, which typically mature within six months.
At December 31, 1998 and 1997, the Company held
$829 million and $744 million, respectively, of col-
lateral supporting standby letters of credit and guarantees
and $215 million and $276 million, respectively, of col-
lateral supporting commercial and other letters of credit.
Other financial institutions have committed to extend
lines of credit to the Company of $10.3 billion and
$9.7 billion at December 31, 1998 and 1997, respectively.
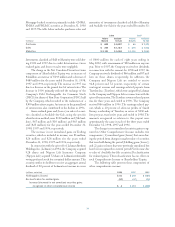
NOTE 8 FAIR VALUES OF FINANCIAL INSTRUMENTS
The following table discloses fair value information for
most on- and off-balance sheet financial instruments.
Certain financial instruments, such as life insurance
obligations, employee benefit obligations and investments
accounted for under the equity method are excluded. The
fair values of financial instruments are estimates based
upon market conditions and perceived risks at December
31, 1998 and 1997 and require management judgment.
These figures may not be indicative of their future
fair values.
December 31, (millions) 1998 1997
Carrying Fair Carrying Fair
Value Value Value Value
Financial Assets
Assets for which carrying values approximate fair values $ 55,434 $ 55,434 $ 51,037 $ 51,037
Investments $ 41,299 $ 42,166 $ 39,648 $ 40,401
Loans $ 21,258 $ 21,029 $ 20,269 $ 20,206
Derivative financial instruments, net $ 147 $ 172 $273 $241
Financial Liabilities
Liabilities for which carrying values approximate fair values $ 48,404 $ 48,404 $ 44,383 $ 44,383
Fixed annuity reserves $ 19,855 $ 19,145 $ 20,731 $ 19,882
Investment certificate reserves $ 4,821 $ 4,830 $ 4,112 $ 3,979
Long-term debt $ 7,019 $ 7,222 $ 7,873 $ 7,903
Separate account liabilities $ 25,005 $ 24,179 $ 21,489 $ 20,708
The carrying and fair values of other off-balance sheet
financial instruments are not material as of December 31,
1998 and 1997. See Notes 2 and 7 for carrying and fair
value information regarding investments and derivative
financial instruments. The following methods were used
to estimate the fair values of financial assets and finan-
cial liabilities:
FINANCIAL ASSETS
Assets for which Carrying Values Approximate Fair
Values: The carrying values of Cash and Cash Equivalents,
Accounts Receivable and Accrued Interest, Separate
Account Assets and applicable Other Assets approximate
their fair values.
Loans: For variable rate loans that reprice within a
year where there has been no significant change in coun-
terparties’ creditworthiness, fair values are based on
carrying values. The fair values of all other loans, except
for loans with significant credit deterioration, are esti-
mated using discounted cash flow analysis, based on
current interest rates for loans with similar terms to bor-
rowers of similar credit quality. For loans with significant
credit deterioration, fair values are based on revised
estimates of future cash flows discounted at rates com-
mensurate with the risk inherent in the revised cash flow