American Express 1998 Annual Report Download - page 31
Download and view the complete annual report
Please find page 31 of the 1998 American Express annual report below. You can navigate through the pages in the report by either clicking on the pages listed below, or by using the keyword search tool below to find specific information within the annual report.-
 1
1 -
2
-
3
-
4
-
5
-
6
-
7
-
8
-
9
-
10
-
11
-
12
-
13
-
14
-
15
-
16
-
17
-
18
-
19
-
20
-
 21
21 -
 22
22 -
 23
23 -
 24
24 -
 25
25 -
 26
26 -
 27
27 -
 28
28 -
 29
29 -
 30
30 -
 31
31 -
 32
32 -
 33
33 -
 34
34 -
 35
35 -
 36
36 -
 37
37 -
 38
38 -
 39
39 -
 40
40 -
 41
41 -
42
-
43
-
44
-
45
-
46
-
47
-
48
-
49
-
50
-
51
-
52
-
53
-
54
-
55
-
56
-
57
-
58
-
59
-
60
-
61
-
62
-
63
 |
 |

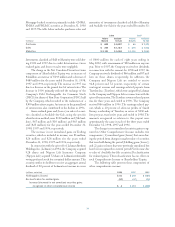
LIQUIDITY AND CAPITAL RESOURCES
SELECTED BALANCE SHEET INFORMATION
(Amounts in billions, except percentages and where indicated)
December 31, 1998 1997
Travelers Cheque Investments $ 6.3 $ 5.9
Total Loans $ 5.6 $ 6.2
Total Nonperforming Loans (millions) $180 $47
Other Nonperforming Assets (millions) $63$11
Reserve for Credit Losses (millions)* $259 $137
Loan Loss Reserve as a Percentage of
Total Loans 3.8% 2.1%
Total Assets $ 18.5 $ 19.6
Deposits $ 8.3 $ 8.5
Travelers Cheques Outstanding $ 5.8 $ 5.6
Total Liabilities $ 17.3 $ 18.4
Total Shareholder’s Equity (millions) $ 1,197 $ 1,248
Return on Average Assets** 0.23% 1.40%
Return on Average Common Equity** 4.9% 28.7%
Risk-Based Capital Ratios:
Tier I 9.8% 8.8%
Total 12.6% 12.3%
Leverage Ratio 5.5% 5.3%
* Allocation (millions)
Loans $214 $131
Other Assets, primarily derivatives 43 6
Other Liabilities 2—
Total Credit Loss Reserves $259 $137
** Excluding the effect of SFAS No. 115.
AEB had approximately $5.6 billion outstanding in world-
wide loans at December 31, 1998, down from $6.2 billion
at December 31, 1997. The decline from the prior year was
largely in the Asia/Pacific region; corporate and correspon-
dent banking loans fell by $0.8 billion, however consumer
and private banking loans rose by $0.3 billion. Other bank-
ing activities, such as securities, unrealized gains on foreign
exchange and derivatives contracts, various contingencies and
market placements, added approximately $7.6 billion to
AEB’s credit exposures at December 31, 1998 (compared
with $8.1 billion at December 31, 1997). The decline in
these other exposures from December 31, 1997 mainly
reflects lower exposures in the Asia/Pacific region. The 1998
reserve for credit losses reflects an increase due to a $213 mil-
lion provision, which was partially offset by write-offs related
to the Asia/Pacific region, particularly Indonesia. Besides the
decrease in total loans, AEB/TC total assets declined mainly
due to lower unrealized gains on foreign exchange and deriv-
ative contracts, primarily in Asia.
The Company has taken steps to ensure that AEB
remains well capitalized, as defined by regulatory guide-
lines. In April 1998, the Company purchased $225 million
of deferred tax assets from AEB, thereby reducing non-
qualifying assets and increasing regulatory capital. The
Company expects to be able to utilize these deferred tax
assets over time within its consolidated tax return and,
therefore, realize full value.
29
CORPORATE AND OTHER
CONSOLIDATED LIQUIDITY AND CAPITAL RESOURCES
Corporate and Other reported net expenses of $84 mil-
lion and $152 million in 1998 and 1997, respectively, and
income of $134 million in 1996. 1998 results include
income of $78 million after-tax ($106 million pretax)
comprising a $39 million after-tax ($60 million pretax) gain
from sales of common stock of First Data Corporation and
a $39 million after-tax ($46 million pretax) preferred stock
dividend based on earnings from Lehman Brothers. The
1996 amount includes a $300 million after-tax ($480 mil-
lion pretax) gain on the exchange of the Company’s DECS
and a $13 million after-tax ($20 million pretax) charge pri-
marily related to the early retirement of debt. Excluding
the above items, Corporate and Other had net expenses of
$162 million in 1998 and $153 million in 1996.
Results for all three years include a benefit due to an
earnings payout from Travelers Inc. (Travelers), related to
the 1993 sale of the Shearson Lehman Brothers Division
(the 1993 sale). 1998 also reflects a benefit from the sale of
securities and adjustment of valuation allowances related to
certain corporate assets. 1996 results include the Company’s
share of a participation in Travelers’ revenue, in accordance
with the 1993 sale. The above items were offset by busi-
ness building initiatives and Y2K costs related to Millenniax
in all three years.
The Company believes allocating capital to businesses with
a return on risk-adjusted equity in excess of its cost of
equity and sustained earnings growth in its core business
will continue to build shareholder value.
The Company’s philosophy is to retain enough earn-
ings to help achieve its goals of earnings per share growth
in the 12 to 15 percent range. As further described in
Note 6 to the Consolidated Financial Statements, the
Company has undertaken a systematic share repurchase
program to offset new share issuances. To the extent
retained earnings exceed investment opportunities, the
Company has returned excess capital to shareholders.
FINANCING ACTIVITIES
The Company has procedures to transfer immediately
short-term funds within the Company to meet liquidity
needs. These internal transfer mechanisms are subject to and
comply with various contractual and regulatory constraints.
The parent company generally meets its short-term
funding needs through an intercompany dividend policy and
by the issuance of commercial paper. The Board of Directors
has authorized a parent company commercial paper program
that is supported by a $1.3 billion multi-purpose credit facil-
ity that expires in increments from 1999 through 2002. No
borrowings have been made under this credit facility. There