American Express 1998 Annual Report Download - page 45
Download and view the complete annual report
Please find page 45 of the 1998 American Express annual report below. You can navigate through the pages in the report by either clicking on the pages listed below, or by using the keyword search tool below to find specific information within the annual report.-
 1
1 -
2
-
3
-
4
-
5
-
6
-
7
-
8
-
9
-
10
-
11
-
12
-
13
-
14
-
15
-
16
-
17
-
18
-
19
-
20
-
21
-
22
-
23
-
24
-
25
-
26
-
27
-
28
-
29
-
30
-
31
-
32
-
33
-
34
-
 35
35 -
 36
36 -
 37
37 -
 38
38 -
 39
39 -
 40
40 -
 41
41 -
 42
42 -
 43
43 -
 44
44 -
 45
45 -
 46
46 -
 47
47 -
 48
48 -
 49
49 -
 50
50 -
 51
51 -
 52
52 -
 53
53 -
 54
54 -
 55
55 -
56
-
57
-
58
-
59
-
60
-
61
-
62
-
63
 |
 |

43
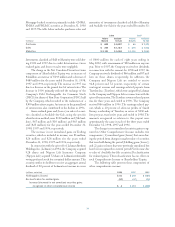
The average aggregate fair values of derivative financial
instruments held for trading purposes were computed
based on monthly information. Net derivative trading
gains of $137 million and $103 million for 1998 and
1997, respectively, were primarily due to trading in for-
eign currency forward and spot contracts and are included
in Other Commissions and Fees.
INTEREST RATE PRODUCTS
The Company uses interest rate products, principally
swaps, primarily to manage funding costs related to Travel
Related Services’ (TRS) Charge Card and Cardmember
lending businesses. For its Charge Card products, TRS
uses interest rate swaps to achieve a targeted mix of fixed
and floating rate funding. For its Cardmember loans, which
are linked to a floating rate base and generally reprice each
month, TRS generally enters into interest rate swaps pay-
ing rates that reprice similarly with changes in the base rate
of the underlying loans.
AEB uses interest rate products to manage its port-
folio of loans, deposits and, to a lesser extent, securities
holdings. The termination dates of nontrading interest
1997
Notional Carrying Value Fair Value
(millions) Amount Asset Liability Asset Liability
Interest Rate Products:
Interest rate swaps $ 12,573 $ 95 $ 49 $ 154 $ 102
Interest rate caps and floors purchased 6,100 27 — 20 —
Forward rate agreements 763————
Total Interest Rate Products 19,436 122 49 174 102
Foreign currency forward and spot contracts 11,289 80 39 220 203
Other Products 1,876 86 44 87 52
Total $ 32,601 $ 288 $132 $ 481 $ 357
TRADING 1998
Notional Carrying/Fair Value Average Fair Value
(millions) Amount Asset Liability Asset Liability
Interest Rate Products:
Interest rate swaps $ 1,266 $ 59 $ 51 $ 80 $ 63
Financial futures sold 949 — 1 — —
Other 1861649
Total Interest Rate Products 2,401 60 58 84 72
Foreign Currency Products:*
Forward and spot contracts 16,308 274 232 407 340
Foreign currency options written 1,630 — 53 — 56
Foreign currency options purchased 1,642 51 — 55 —
Total Foreign Currency Products 19,580 325 285 462 396
Total $ 21,981 $ 385 $ 343 $ 546 $ 468
1997
Notional Carrying/Fair Value Average Fair Value
(millions) Amount Asset Liability Asset Liability
Interest Rate Products:
Interest rate swaps $ 2,165 $ 72 $ 63 $ 37 $ 33
Other 588 4 10 1 2
Total Interest Rate Products 2,753 76 73 38 35
Foreign Currency Products:*
Forward and spot contracts 13,120 827 714 333 247
Foreign currency options written 2,755 — 50 — 36
Foreign currency options purchased 2,586 51 — 36 —
Total Foreign Currency Products 18,461 878 764 369 283
Total $ 21,214 $ 954 $ 837 $ 407 $ 318
* These are predominantly contracts with clients and the related hedges of those client contracts. The Company’s net trading foreign currency exposure was approximately
$63 million and $38 million at December 31, 1998 and 1997, respectively.