American Express 2007 Annual Report Download - page 18
Download and view the complete annual report
Please find page 18 of the 2007 American Express annual report below. You can navigate through the pages in the report by either clicking on the pages listed below, or by using the keyword search tool below to find specific information within the annual report.-
 1
1 -
2
-
3
-
4
-
5
-
6
-
7
-
 8
8 -
 9
9 -
 10
10 -
 11
11 -
 12
12 -
 13
13 -
 14
14 -
 15
15 -
 16
16 -
 17
17 -
 18
18 -
 19
19 -
 20
20 -
 21
21 -
 22
22 -
 23
23 -
 24
24 -
 25
25 -
 26
26 -
 27
27 -
 28
28 -
29
-
30
-
31
-
32
-
33
-
34
-
35
-
36
-
37
-
38
-
39
-
40
-
41
-
42
-
43
-
44
-
45
-
46
-
47
-
48
-
49
-
50
-
51
-
52
-
53
-
54
-
55
-
56
-
57
-
58
-
59
-
60
-
61
-
62
-
63
-
64
-
65
-
66
-
67
-
68
-
69
-
70
-
71
-
72
-
73
-
74
-
75
-
76
-
77
-
78
-
79
-
80
-
81
-
82
-
83
-
84
-
85
-
86
-
87
-
88
-
89
-
90
-
91
-
92
-
93
-
94
-
95
-
96
-
97
-
98
-
99
-
100
-
101
-
102
-
103
-
104
-
105
-
106
-
107
-
108
-
109
-
110
-
111
-
112
-
113
-
114
-
115
-
116
-
117
-
118
 |
 |

At the same time, we are keeping a tight rein on operating expenses and will continue to reengineer
our business processes to increase efficiency. We also will use the added flexibility that we have built
into our planning and budgeting processes in recent years to adjust to changing market conditions and
direct investments to higher-return options. We intend to continue to invest in growth opportunities at
a high level.
SHAREHOLDER RETURNS
A tougher operating environment is never welcome news for investors, and our share price felt the effects
of general anxiety about the economy even before we witnessed any noticeable changes in consumer
behavior. For the year, American Express’ stock declined 14.3 percent. This performance compared favor-
ably to our closest peer group, the S&P Financials, which declined 20.8 percent amid subprime losses and
other well-publicized problems in the financial sector. Outperforming a lagging sector is small consolation,
however, especially when our share price underperformed broader indices. For the year, the Dow Jones
Industrial Average rose 6.4 percent and the S&P 500 rose 3.5 percent.
We continue to focus on those elements that we believe will create long-term value for our shareholders:
our unique spend-centric business model, an excellent position in the premium segment of the market,
the industry’s most successful rewards programs, a brand that resonates with consumers and corporate
customers, responsible capital management, and our ability to deliver products and services that stand out.
As always, we will strive to ensure that our shareholder returns reflect the significant growth potential of
our business.
LETTER TO SHAREHOLDERS
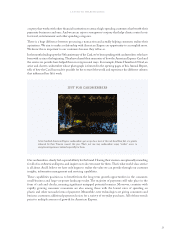
COMPARISON OF FIVE-YEAR TOTAL RETURN TO SHAREHOLDERS
(Cumulative value of $100 invested on December 31, 2002)
This chart compares the cumulative total shareholder return on our common shares with the total return on
the S&P 500 Index and the S&P Financial Index for the last five years. It shows the growth of a $100
investment on December 31, 2002, including the reinvestment of all dividends. On September 30, 2005,
American Express distributed to shareholders a special dividend of all its common shares of Ameriprise
Financial, Inc. This distribution is accounted for in the chart as though it were paid in cash and reinvested in
the company’s common shares.
*Source: Bloomberg (returns compounded monthly)
Year-end data* 2002 2003 2004 2005 2006 2007
American Express $ 100.00 $ 137.61 $ 161.82 $ 170.33 $ 202.83 $ 175.67
S&P 500 Index $ 100.00 $ 128.67 $ 142.65 $ 149.65 $ 173.26 $ 182.78
S&P Financial Index $ 100.00 $ 131.01 $ 145.26 $ 154.70 $ 184.41 $ 150.29
16
02 03 04 05 06 07
$0
$50
$100
$150
$200
$250