Apple 1998 Annual Report Download - page 10
Download and view the complete annual report
Please find page 10 of the 1998 Apple annual report below. You can navigate through the pages in the report by either clicking on the pages listed below, or by using the keyword search tool below to find specific information within the annual report.-
 1
1 -
 2
2 -
 3
3 -
 4
4 -
 5
5 -
 6
6 -
 7
7 -
 8
8 -
 9
9 -
 10
10 -
 11
11 -
 12
12 -
 13
13 -
 14
14 -
 15
15 -
 16
16 -
 17
17 -
 18
18 -
 19
19 -
 20
20 -
 21
21 -
22
-
23
-
24
-
25
-
26
-
27
-
28
-
29
-
30
-
31
-
32
-
33
-
34
-
35
-
36
-
37
-
38
-
39
-
40
-
41
-
42
-
43
-
44
-
45
-
46
-
47
-
48
-
49
-
50
-
51
-
52
-
53
-
54
-
55
-
56
-
57
-
58
-
59
-
60
-
61
-
62
-
63
-
64
-
65
-
66
-
67
-
68
-
69
-
70
-
71
-
72
-
73
-
74
-
75
-
76
-
77
-
78
-
79
-
80
-
81
-
82
-
83
-
84
-
85
-
86
-
87
-
88
-
89
-
90
-
91
-
92
 |
 |
PART II
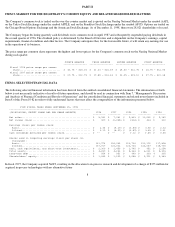
ITEM 5. MARKET FOR THE REGISTRANT'S COMMON EQUITY AND RELATED SHAREHOLDER MATTERS
The Company's common stock is traded on the over-the-
counter market and is quoted on the Nasdaq National Market under the symbol AAPL,
on the Tokyo Stock Exchange under the symbol APPLE, and on the Frankfurt Stock Exchange under the symbol APCD. Options are traded on
the Chicago Board Options Exchange and the American Stock Exchange. As of December 11, 1998, there were 28,021 shareholders of record.
The Company began declaring quarterly cash dividends on its common stock in April 1987 and subsequently suspended paying dividends in
the second quarter of 1996. The dividend policy is determined by the Board of Directors and is dependent on the Company's earnings, capital
requirements, financial condition and other factors. The Company anticipates that, for the foreseeable future, it will retain any earnings for use
in the operation of its business.
The price range per common share represents the highest and lowest prices for the Company's common stock on the Nasdaq National Market
during each quarter.
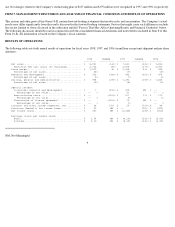
ITEM 6. SELECTED FINANCIAL DATA
The following selected financial information has been derived from the audited consolidated financial statements. The information set forth
below is not necessarily indicative of results of future operations, and should be read in conjunction with Item 7, "Management's Discussion
and Analysis of Financial Condition and Results of Operations" and the consolidated financial statements and related notes thereto included in
Item 8 of this Form 10-K in order to fully understand factors that may affect the comparability of the information presented below.
In fiscal 1997, the Company acquired NeXT, resulting in the allocation to in-process research and development of a charge of $375 million for
acquired in-process technologies with no alternative future
8
FOURTH QUARTER THIRD QUARTER SECOND QUARTER FIRST QUARTER
----------------- ----------------- ----------------- -----------------
Fiscal 1998 price range per common
share.............................. $ 43.75 - $28.06 $ 31.63 - $24.69 $ 28.00 - $12.75 $ 24.75 - $12.94
Fiscal 1997 price range per common
share.............................. $ 29.75 - $12.75 $ 19.88 - $14.63 $ 23.25 - $15.12 $ 27.75 - $21.38
FIVE FISCAL YEARS ENDED SEPTEMBER 25, 1998
-----------------------------------------------------------
(IN MILLIONS, EXCEPT SHARE AND PER SHARE AMOUNTS) 1998 1997 1996 1995 1994
--------- --------- --------- --------- ---------
Net sales.................................................. $ 5,941 $ 7,081 $ 9,833 $ 11,062 $ 9,189
Net income (loss).......................................... $ 309 $ (1,045) $ (816) $ 424 $ 310
Earnings (loss) per common share:
Basic.................................................... $ 2.34 $ (8.29) $ (6.59) $ 3.50 $ 2.63
Diluted.................................................. $ 2.10 $ (8.29) $ (6.59) $ 3.45 $ 2.61
Cash dividends declared per common share................... $ -- $ -- $ 0.12 $ 0.48 $ 0.48
Shares used in computing earnings (loss) per share (in
thousands):
Basic.................................................... 131,974 126,062 123,734 121,192 117,808
Diluted.................................................. 167,917 126,062 123,734 123,047 118,735
Cash, cash equivalents, and short-term investments......... $ 2,300 $ 1,459 $ 1,745 $ 952 $ 1,258
Total assets............................................... $ 4,289 $ 4,233 $ 5,364 $ 6,231 $ 5,303
Long-term debt............................................. $ 954 $ 951 $ 949 $ 303 $ 305
Shareholders' equity....................................... $ 1,642 $ 1,200 $ 2,058 $ 2,901 $ 2,383