Apple 1998 Annual Report Download - page 12
Download and view the complete annual report
Please find page 12 of the 1998 Apple annual report below. You can navigate through the pages in the report by either clicking on the pages listed below, or by using the keyword search tool below to find specific information within the annual report.-
 1
1 -
 2
2 -
 3
3 -
 4
4 -
 5
5 -
 6
6 -
 7
7 -
 8
8 -
 9
9 -
 10
10 -
 11
11 -
 12
12 -
 13
13 -
 14
14 -
 15
15 -
 16
16 -
 17
17 -
 18
18 -
 19
19 -
 20
20 -
 21
21 -
 22
22 -
23
-
24
-
25
-
26
-
27
-
28
-
29
-
30
-
31
-
32
-
33
-
34
-
35
-
36
-
37
-
38
-
39
-
40
-
41
-
42
-
43
-
44
-
45
-
46
-
47
-
48
-
49
-
50
-
51
-
52
-
53
-
54
-
55
-
56
-
57
-
58
-
59
-
60
-
61
-
62
-
63
-
64
-
65
-
66
-
67
-
68
-
69
-
70
-
71
-
72
-
73
-
74
-
75
-
76
-
77
-
78
-
79
-
80
-
81
-
82
-
83
-
84
-
85
-
86
-
87
-
88
-
89
-
90
-
91
-
92
 |
 |
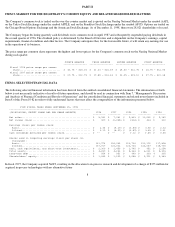
The following table sets forth quarterly results of operations for fiscal 1998 and 1997 (in millions except unit shipment and per share amounts):
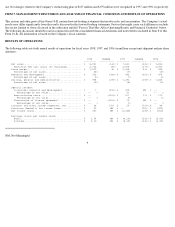
OVERVIEW
During 1998, the Company returned to profitability, reporting net income in all four quarters of the fiscal year. Profitability was achieved for
several major reasons. First, the Company continued and essentially completed a restructuring plan which it began in 1996. The restructuring
plan has led to reductions in headcount and related expenses in all areas of the Company's business and the write-down and disposal of certain
operating assets. Consequently, operating expenses, not including cost of sales and special charges, declined $560 million or 32% to $1.21
billion in 1998 compared to 1997. Second, gross margin improved in 1998, rising to 25% of net sales in 1998 compared to 19% in 1997. In
addition to benefits derived from the restructuring plan and an overall decline in component costs, margins were favorably affected by actions
which improved overall inventory management and actions taken to simplify and focus the Company's product line. Third, the Company made
changes to its distribution channel policies which further contributed to the decline in selling, general and administrative expenses and the
increased gross margin.
Despite the return to profitability in 1998, the Company reported sequential declines in quarterly net sales in each of the first three quarters of
the fiscal year and reported year-over-year declines in net sales during every quarter of 1998. Despite positive signs of growth in the fourth
quarter, including a sequential rise in net sales and unit sales over the third quarter and a year-over-over increase in unit sales over the fourth
quarter of 1997, total net sales declined 16% in fiscal 1998 compared to 1997.
The Company's future operating results and financial condition are dependent upon the Company's ability to successfully develop,
manufacture, and market technologically innovative products in order to meet the dynamic conditions within the highly competitive market for
personal computers. Potential risks and uncertainties that could affect the Company's future operating results and financial condition include,
among other things, continued competitive pressures in the marketplace and the effect of any reaction by the Company to such competitive
pressures, including pricing actions by the Company; the availability of
10
YEAR ENDED SEPTEMBER 25, 1998 YEAR ENDED SEPTEMBER 26, 1997
-------------------------------------------------- -------------------------------------
FOURTH THIRD SECOND FIRST FOURTH THIRD SECOND
QUARTER QUARTER QUARTER QUARTER QUARTER QUARTER QUARTER
----------- ----------- ----------- ----------- ----------- ----------- -----------
Net sales.......................... $ 1,556 $ 1,402 $ 1,405 $ 1,578 $ 1,614 $ 1,737 $ 1,601
Macintosh CPU unit sales (in
thousands)..................... 834 644 650 635 652 697 602
Gross margin....................... $ 417 $ 360 $ 349 $ 353 $ 320 $ 348 $ 303
Gross margin percentage.......... 27% 26% 25% 22% 20% 20% 19%
Operating expenses................. $ 308 $ 292 $ 298 $ 313 $ 353 $ 408 $ 489
Special charges.................... -- 7 -- -- 137 -- 530
Operating margin................... 109 61 51 40 (170) (60) (716)
Operating margin percentage...... 7% 4% 4% 3% (11)% (3)% (45)%
Other income and (expense), net.... $ 5 $ 48 $ 8 $ 7 $ 9 $ 4 $ 8
Income tax expense................. 8 8 4 -- -- -- --
Net income (loss).................. $ 106 $ 101 $ 55 $ 47 $ (161) $ (56) $ (708)
Earnings (loss) per common share:
Basic............................ $ 0.79 $ 0.76 $ 0.42 $ 0.37 $ (1.26) $ (0.44) $ (5.64)
Diluted.......................... $ 0.68 $ 0.65 $ 0.38 $ 0.33 $ (1.26) $ (0.44) $ (5.64)
FIRST
QUARTER
-----------
Net sales.......................... $ 2,129
Macintosh CPU unit sales (in
thousands)..................... 923
Gross margin....................... $ 397
Gross margin percentage.......... 19%
Operating expenses................. $ 521
Special charges.................... --
Operating margin................... (124)
Operating margin percentage...... (6)%
Other income and (expense), net.... $ 4
Income tax expense................. --
Net income (loss).................. $ (120)
Earnings (loss) per common share:
Basic............................ $ (0.96)
Diluted.......................... $ (0.96)