Apple 1999 Annual Report Download - page 13
Download and view the complete annual report
Please find page 13 of the 1999 Apple annual report below. You can navigate through the pages in the report by either clicking on the pages listed below, or by using the keyword search tool below to find specific information within the annual report.-
 1
1 -
2
-
 3
3 -
 4
4 -
 5
5 -
 6
6 -
 7
7 -
 8
8 -
 9
9 -
 10
10 -
 11
11 -
 12
12 -
 13
13 -
 14
14 -
 15
15 -
 16
16 -
 17
17 -
 18
18 -
 19
19 -
 20
20 -
 21
21 -
 22
22 -
 23
23 -
24
-
25
-
26
-
27
-
28
-
29
-
30
-
31
-
32
-
33
-
34
-
35
-
36
-
37
-
38
-
39
-
40
-
41
-
42
-
43
-
44
-
45
-
46
-
47
-
48
-
49
-
50
-
51
-
52
-
53
-
54
-
55
-
56
-
57
-
58
-
59
-
60
-
61
-
62
-
63
-
64
-
65
-
66
-
67
-
68
-
69
-
70
-
71
-
72
-
73
-
74
-
75
-
76
-
77
-
78
-
79
-
80
-
81
-
82
-
83
-
84
-
85
-
86
-
87
-
88
-
89
-
90
-
91
-
92
-
93
-
94
-
95
-
96
-
97
-
98
-
99
-
100
-
101
-
102
-
103
-
104
-
105
-
106
-
107
-
108
-
109
-
110
-
111
-
112
-
113
-
114
-
115
-
116
-
117
-
118
-
119
-
120
-
121
-
122
-
123
-
124
-
125
-
126
-
127
-
128
-
129
-
130
-
131
-
132
-
133
-
134
-
135
-
136
-
137
 |
 |
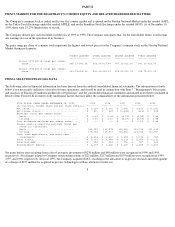
The following table sets forth quarterly results of operations for fiscal 1999 and 1998 (in millions, except unit shipment and per share
amounts):
OVERVIEW
During 1999, the Company experienced a 25% rise in Macintosh unit sales. This increase is primarily attributable to the success of iMac, the
Company's moderately priced desktop Macintosh system designed for the education and consumer markets. The Company sold approximately
1.8 million iMac units in 1999, an increase of approximately 730,000 units or 68% over unit sales of similar products in 1998. Growth in unit
sales was strong in all of the Company's geographic operating segments, particularly in Japan and Asia Pacific due to strong acceptance of
iMac in those regions and the general economic improvements experienced in much of Asia during the year. The Company also experienced
improved profitability in 1999. Operating income before special charges rose 44% or $118 million to $386 million in 1999 from $268 million
in 1998. Contributing to the improvement in operating margin in 1999 was a rise in gross margin as a percentage of net sales to 28% as
compared to 25% in 1998. The impact of improved gross margins was partially offset by planned increases in recurring operating expenses
during 1999 of 8% to a total of $1.337 billion.
Despite improved unit sales and improved profitability, the Company's net sales rose only 3% in 1999 to $6.134 billion. Growth in net sales
was negatively impacted during the year by declines in the average revenue per Macintosh system for both Power Macintosh and iMac systems
and by a shift in unit mix towards the lower priced iMac systems. Net sales were also negatively impacted during the fourth quarter of 1999
due to lower than planned deliveries of PowerPC G4 processors from Motorola. The primary focus of the Company during fiscal 2000 remains
achieving meaningful year-over-year growth in both unit sales and net sales.
The Company's future operating results and financial condition are dependent upon the Company's ability to successfully develop,
manufacture, and market technologically innovative products in order to meet the dynamic conditions within the highly competitive market for
personal computers. Potential risks and uncertainties that could affect the Company's future operating results and financial condition are
discussed
10
YEAR ENDED SEPTEMBER 25, 1999 YEAR ENDED SEPTEMBER 25, 1998
----------------------------------------- -----------------------------------------
FOURTH THIRD SECOND FIRST FOURTH THIRD SECOND FIRST
QUARTER QUARTER QUARTER QUARTER QUARTER QUARTER QUARTER QUARTER
-------- -------- -------- -------- -------- -------- -------- --------
Net sales................... $1,336 $1,558 $1,530 $1,710 $1,556 $1,402 $1,405 $1,578
Macintosh CPU unit sales
(in thousands).......... 772 905 827 944 834 644 650 635
Gross margin................ $ 384 $ 427 $ 403 $ 482 $ 417 $ 360 $ 349 $ 353
Gross margin percentage... 29% 27% 26% 28% 27% 26% 25% 22%
Operating expenses.......... $ 317 $ 323 $ 315 $ 355 $ 308 $ 292 $ 298 $ 313
Special charges............. 18 -- 9 -- -- 7 -- --
Operating margin............ 49 104 79 127 109 61 51 40
Operating margin
percentage.............. 4% 7% 5% 7% 7% 4% 4% 3%
Gains from sales of
investment................ $ 42 $ 101 $ 55 $ 32 -- $ 40 -- --
Interest and other income,
net....................... $ 34 $ 24 $ 19 $ 10 $ 5 $ 8 $ 8 $ 7
Provision for income
taxes..................... 14 26 18 17 8 8 4 --
Net income.................. $ 111 $ 203 $ 135 $ 152 $ 106 $ 101 $ 55 $ 47
Earnings per common share:
Basic..................... $ 0.69 $ 1.41 $ 0.99 $ 1.12 $ 0.79 $ 0.76 $ 0.42 $ 0.37
Diluted................... $ 0.63 $ 1.20 $ 0.84 $ 0.95 $ 0.68 $ 0.65 $ 0.38 $ 0.33