Apple 1999 Annual Report Download - page 16
Download and view the complete annual report
Please find page 16 of the 1999 Apple annual report below. You can navigate through the pages in the report by either clicking on the pages listed below, or by using the keyword search tool below to find specific information within the annual report.-
 1
1 -
2
-
3
-
4
-
5
-
 6
6 -
 7
7 -
 8
8 -
 9
9 -
 10
10 -
 11
11 -
 12
12 -
 13
13 -
 14
14 -
 15
15 -
 16
16 -
 17
17 -
 18
18 -
 19
19 -
 20
20 -
 21
21 -
 22
22 -
 23
23 -
 24
24 -
 25
25 -
 26
26 -
27
-
28
-
29
-
30
-
31
-
32
-
33
-
34
-
35
-
36
-
37
-
38
-
39
-
40
-
41
-
42
-
43
-
44
-
45
-
46
-
47
-
48
-
49
-
50
-
51
-
52
-
53
-
54
-
55
-
56
-
57
-
58
-
59
-
60
-
61
-
62
-
63
-
64
-
65
-
66
-
67
-
68
-
69
-
70
-
71
-
72
-
73
-
74
-
75
-
76
-
77
-
78
-
79
-
80
-
81
-
82
-
83
-
84
-
85
-
86
-
87
-
88
-
89
-
90
-
91
-
92
-
93
-
94
-
95
-
96
-
97
-
98
-
99
-
100
-
101
-
102
-
103
-
104
-
105
-
106
-
107
-
108
-
109
-
110
-
111
-
112
-
113
-
114
-
115
-
116
-
117
-
118
-
119
-
120
-
121
-
122
-
123
-
124
-
125
-
126
-
127
-
128
-
129
-
130
-
131
-
132
-
133
-
134
-
135
-
136
-
137
 |
 |
included under the heading "Factors That May Affect Future Results and Financial Condition," which information is hereby incorporated by
reference.
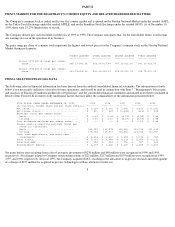
GROSS MARGIN
Gross margin increased as a percentage of net sales during 1999 to 28% as compared to 25% in 1998. This increase was primarily attributable
to declines in the cost of various components of the Company's products, improvements in manufacturing efficiencies brought about by
selective outsourcing of final assembly of certain of the Company's products, improved design of products leading to lower manufacturing and
warranty costs, and relatively stable pricing of the Company's products over the last six months of 1999. During 1999, the Company was also
able to fully realize the benefits of actions taken primarily in 1998 and 1997 that led to improved inventory management and a more efficient
distribution model for its products. These improvements are discussed below.
Gross margin increased as a percentage of net sales during 1998 to 25% compared to 19% in 1997. This increase was primarily the result of a
shift in revenue mix toward the Company's higher margin Power Macintosh G3 systems and newer PowerBook G3 systems, the low volume of
lower margin consumer products shipped during the first three quarters of 1998, and the declining cost of various components of the
Company's products, particularly those sourced from Asia. Improvements in the Company's inventory management also contributed to the
increase in gross margins. During 1998, the Company simplified its product line, moving from approximately 15 separate individual products
to three main product families. Further, the Company attempted to use as many industry standard parts in its newer products as possible,
expanded the use of supplier hubs at manufacturing sites, and outsourced the manufacture of printed circuit boards and some systems assembly.
These changes have allowed the Company to more accurately forecast demand, reduce inventory carrying levels and related costs, lessen the
financial exposure resulting from inventory obsolescence and excess inventory levels, and reduce the component cost of obtaining certain
standardized parts. The Company also made changes to its distribution model during 1998 and 1997 that contributed to the increase in gross
margins in 1998. The Company significantly reduced the number of locations where it stages finished goods, generally holding inventory on a
regional basis rather than in each country. Also, the Company significantly reduced the number of its distributors, authorized resellers, and
national retail channel partners, particularly in the United States. These changes allowed the Company to reduce
inventory and related financial
exposures and reduced the inventory and related financial exposure associated with inventory held in the Company's distribution channels. The
Company has also revised its distribution channel policies by decreasing the price protection and stock return privileges of its distributors and
resellers.
The Company anticipates that as lower priced consumer products become a larger share of net sales and the overall industry trend toward
lower-priced products continues, gross margins will decline during fiscal 2000. The foregoing statement is forward-looking. The Company's
actual results could differ because of several factors, including those set forth in the following paragraph and below in the subsection entitled
"Factors That May Affect Future Results and Financial Condition."
There can be no assurance targeted gross margin levels will be achieved or current margins on existing individual products will be maintained.
In general, gross margins and margins on individual products will remain under significant downward pressure due to a variety of factors,
including continued industry wide global pricing pressures, increased competition, compressed product life cycles, potential increases in the
cost and availability of raw material and outside manufacturing services, and potential changes to the Company's product mix, including higher
unit sales of consumer products with lower average selling prices and lower gross margins. In response to these downward pressures, the
Company expects it will continue to take pricing actions with respect to its products. Gross margins could also be affected by the Company's
ability to effectively manage quality problems and warranty costs and to stimulate demand for certain of its products. The Company's operating
strategy and pricing take into account anticipated changes in foreign
13