Apple 1999 Annual Report Download - page 20
Download and view the complete annual report
Please find page 20 of the 1999 Apple annual report below. You can navigate through the pages in the report by either clicking on the pages listed below, or by using the keyword search tool below to find specific information within the annual report.-
 1
1 -
2
-
3
-
4
-
5
-
6
-
7
-
8
-
9
-
 10
10 -
 11
11 -
 12
12 -
 13
13 -
 14
14 -
 15
15 -
 16
16 -
 17
17 -
 18
18 -
 19
19 -
 20
20 -
 21
21 -
 22
22 -
 23
23 -
 24
24 -
 25
25 -
 26
26 -
 27
27 -
 28
28 -
 29
29 -
 30
30 -
31
-
32
-
33
-
34
-
35
-
36
-
37
-
38
-
39
-
40
-
41
-
42
-
43
-
44
-
45
-
46
-
47
-
48
-
49
-
50
-
51
-
52
-
53
-
54
-
55
-
56
-
57
-
58
-
59
-
60
-
61
-
62
-
63
-
64
-
65
-
66
-
67
-
68
-
69
-
70
-
71
-
72
-
73
-
74
-
75
-
76
-
77
-
78
-
79
-
80
-
81
-
82
-
83
-
84
-
85
-
86
-
87
-
88
-
89
-
90
-
91
-
92
-
93
-
94
-
95
-
96
-
97
-
98
-
99
-
100
-
101
-
102
-
103
-
104
-
105
-
106
-
107
-
108
-
109
-
110
-
111
-
112
-
113
-
114
-
115
-
116
-
117
-
118
-
119
-
120
-
121
-
122
-
123
-
124
-
125
-
126
-
127
-
128
-
129
-
130
-
131
-
132
-
133
-
134
-
135
-
136
-
137
 |
 |

The Company anticipates its effective tax rate for fiscal 2000 will be approximately 25%. The foregoing statement is forward-looking. The
Company's actual results could differ because of several factors, including those set forth below in the subsection entitled "Factors That May
Affect Future Results and Financial Condition." Additionally, the actual future tax rate will be significantly impacted by the amount of and
jurisdiction in which the Company's foreign profits are earned.
LIQUIDITY AND CAPITAL RESOURCES
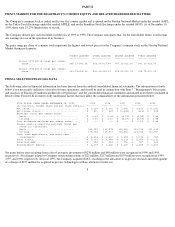
The following table presents selected financial information and statistics for each of the last three fiscal years (dollars in millions):
(a) Based on ending net trade receivables and most recent quarterly net sales for each period.
(b) Based on ending inventory and most recent quarterly cost of sales for each period.
As of September 25, 1999, the Company had $3.226 billion in cash, cash equivalents, and short-term investments, an increase of $926 million
or 40% over the same balances at the end of fiscal 1998. During fiscal 1999, the Company's primary source of cash was $798 million in cash
flows from operating activities. Cash generated by operations was primarily from net income, declines in accounts receivables and inventory
resulting from improved asset management, and an increase in accounts payable. The Company's cash and cash equivalent balances as of
September 25, 1999 and 1998, include $4 million and $56 million, respectively, pledged as collateral to support letters of credit.
In addition to the net purchase of short-term investments of $1.081 billion, net cash used by investing activities included $112 million for the
purchase of investments in Samsung and Akamai discussed below and $47 million for the purchase of fixed assets. These uses of cash were
partially offset by proceeds from the sale of ARM stock of $245 million and proceeds from the sale of equipment of $23 million. The Company
expects the level of capital expenditures in 2000 will increase moderately from 1999.
In July 1999, the Company's Board of Directors authorized a plan for the Company to repurchase up to $500 million of its common stock. This
repurchase plan does not obligate the Company to acquire any specific number of shares or acquire shares over any specified period of time. As
of September 25, 1999, the Company had repurchased a total of 1.25 million shares of its common stock at a cost of $75 million.
On November 18, 1999, the Company entered into a $100 million revolving credit agreement with Bank of America. Loans under the
agreement pay interest at LIBOR plus 1%, and the Company is required to pay a commitment fee of 0.2% of the unused portion of the credit
facility. No advances have been made against this credit facility. This revolving credit agreement is intended to provide the Company with an
additional source of liquidity and to provide additional support to the Company's capital position in the event of short-term liquidity
disturbances in worldwide financial markets associated with the Year 2000 crossover.
The Company believes its balances of cash, cash equivalents, and short-term investments will be sufficient to meet its cash requirements over
the next twelve months, including any cash utilized by its stock repurchase plan. However, given the Company's current non-investment grade
debt ratings, if the Company should need to obtain short-term borrowings, there can no assurance such borrowings could be
17
1999 1998 1997
-------- -------- --------
Cash, cash equivalents, and short-term investments.......... $3,226 $2,300 $1,459
Accounts receivable, net.................................... $ 681 $ 955 $1,035
Inventory................................................... $ 20 $ 78 $ 437
Working capital............................................. $2,736 $2,178 $1,606
Days sales in accounts receivable(a)........................ 46 56 58
Days of supply in inventory(b).............................. 2 6 31
Operating cash flow......................................... $ 798 $ 775 $ 154