Apple 1999 Annual Report Download - page 14
Download and view the complete annual report
Please find page 14 of the 1999 Apple annual report below. You can navigate through the pages in the report by either clicking on the pages listed below, or by using the keyword search tool below to find specific information within the annual report.-
 1
1 -
2
-
3
-
 4
4 -
 5
5 -
 6
6 -
 7
7 -
 8
8 -
 9
9 -
 10
10 -
 11
11 -
 12
12 -
 13
13 -
 14
14 -
 15
15 -
 16
16 -
 17
17 -
 18
18 -
 19
19 -
 20
20 -
 21
21 -
 22
22 -
 23
23 -
 24
24 -
25
-
26
-
27
-
28
-
29
-
30
-
31
-
32
-
33
-
34
-
35
-
36
-
37
-
38
-
39
-
40
-
41
-
42
-
43
-
44
-
45
-
46
-
47
-
48
-
49
-
50
-
51
-
52
-
53
-
54
-
55
-
56
-
57
-
58
-
59
-
60
-
61
-
62
-
63
-
64
-
65
-
66
-
67
-
68
-
69
-
70
-
71
-
72
-
73
-
74
-
75
-
76
-
77
-
78
-
79
-
80
-
81
-
82
-
83
-
84
-
85
-
86
-
87
-
88
-
89
-
90
-
91
-
92
-
93
-
94
-
95
-
96
-
97
-
98
-
99
-
100
-
101
-
102
-
103
-
104
-
105
-
106
-
107
-
108
-
109
-
110
-
111
-
112
-
113
-
114
-
115
-
116
-
117
-
118
-
119
-
120
-
121
-
122
-
123
-
124
-
125
-
126
-
127
-
128
-
129
-
130
-
131
-
132
-
133
-
134
-
135
-
136
-
137
 |
 |

throughout this Item 7, including the discussion under the heading "Factors That May Affect Future Results and Financial Condition."
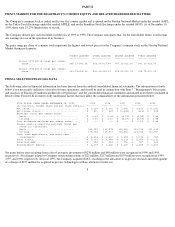
NET SALES
Net sales for geographic segments and Macintosh unit sales by geographic segment and by product follow (net sales in millions and Macintosh
unit sales in thousands):
(a) Unit sales figures for iMac in 1998 and 1997 include sales of the Company's previous consumer and education oriented Macintosh products.
Net sales increased $193 million or 3% to $6.134 billion in 1999 compared to 1998. The primary source of this growth was an overall 25%
increase in Macintosh unit sales, which was reflective of strong unit growth in all of the Company's geographic operating segments. Offsetting
the rise in unit shipments was a decline in the average revenue per Macintosh system, a function of total net sales generated by hardware
shipments and total Macintosh CPU unit sales, which fell 17% to $1,739 from $2,095 in 1998. The decline during 1999 in the average revenue
per Macintosh system is attributable to lower pricing for both iMac and Power Macintosh products, which reflects the continuing overall
industry trend towards lower pricing. The decline is also attributable to the shift in the Company's unit mix toward lower-priced consumer
products such that iMac units and comparable products comprised 52% of total Macintosh unit sales in 1999 versus 39% in 1998.
Net sales declined sequentially during the fourth quarter of 1999 compared to the third quarter by $222 million or 14%, and declined $220
million or 14% compared to the same period in 1998. Similarly, Macintosh unit sales declined 15% and 7% during the fourth quarter of 1999
compared to the third quarter of 1999 and the same period in 1998, respectively. The primary causes for these declines in both net sales and
unit sales were lower than planned deliveries of PowerPC G4 processors from Motorola and production interruptions at vendors supplying
PowerBooks and iBooks experienced during the last week of the fourth quarter of 1999 as a result of the earthquake in Taiwan on September
20, 1999. The shortage of G4 processors reduced net sales by approximately $200 million during the fourth quarter of 1999.
Net sales decreased $1.140 billion, or 16%, to $5.941 billion in 1998 compared to 1997. The decline during 1998 in net sales is attributable to
several factors. The Company experienced a $454 million decrease in net sales of peripheral products during 1998 compared to 1997
principally due to the discontinuance by the
11
1999 CHANGE 1998 CHANGE 1997
-------- -------- -------- -------- --------
Americas net sales................................ $3,527 2 % $3,468 (5)% $3,668
Europe net sales.................................. $1,317 2 % $1,295 (16)% $1,536
Japan net sales................................... $ 858 17 % $ 731 (33)% $1,098
Asia Pacific net sales............................ $ 306 4 % $ 293 (38)% $ 472
Americas Macintosh unit sales..................... 2,021 22 % 1,655 6 % 1,568
Europe Macintosh unit sales....................... 724 23 % 588 (2)% 601
Japan Macintosh unit sales........................ 524 35 % 389 (25)% 516
Asia Pacific Macintosh unit sales................. 179 37 % 131 (31)% 189
------ ------ ------
Total Macintosh unit sales...................... 3,448 25 % 2,763 (4)% 2,874
====== ====== ======
Power Macintosh unit sales........................ 1,296 2 % 1,266 29 % 981
PowerBook unit sales.............................. 344 (19)% 427 2 % 417
iMac unit sales(a)................................ 1,802 68 % 1,070 (28)% 1,476
iBook unit sales.................................. 6 -- -- -- --
------ ------ ------
Total Macintosh unit sales...................... 3,448 25 % 2,763 (4)% 2,874
====== ====== ======