Charter 2001 Annual Report Download - page 18
Download and view the complete annual report
Please find page 18 of the 2001 Charter annual report below. You can navigate through the pages in the report by either clicking on the pages listed below, or by using the keyword search tool below to find specific information within the annual report.-
 1
1 -
2
-
3
-
4
-
5
-
6
-
7
-
 8
8 -
 9
9 -
 10
10 -
 11
11 -
 12
12 -
 13
13 -
 14
14 -
 15
15 -
 16
16 -
 17
17 -
 18
18 -
 19
19 -
 20
20 -
 21
21 -
 22
22 -
 23
23 -
 24
24 -
 25
25 -
 26
26 -
 27
27 -
 28
28
 |
 |

16 of 25
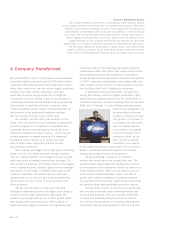
Organizational Structure
Charter Communications, Inc. was organized as a Delaware
corporation in 1999 and conducted an initial public offering
of Class A common stock in November 1999. Certain of
our subsidiaries commenced operations under the “Charter
Communications” name in 1994.
Charter Communications, Inc.’s principal asset is a
46.5% equity interest (assuming no conversion or exchange
of convertible or exchangeable securities) and a 100% voting
interest in Charter Communications Holding Company, LLC.
Charter Communications Holding Company, through its
subsidiaries, owns cable systems and certain strategic
investments. Charter Communications, Inc. provides
management services to Charter Communications Holding
Company and its subsidiaries. As sole manager, Charter
Communications, Inc. controls the affairs of Charter
Communications Holding Company and its subsidiaries.
Some of the membership units in certain of Charter
Communications, Inc.’s subsidiaries are exchangeable at
any time for shares of Class A common stock of Charter
Communications, Inc. on a one-for-one basis. The following
table sets forth the pro forma outstanding shares of Charter
Communications, Inc. as if all exchangeable membership
units in subsidiaries had been exchanged for Charter
Communications, Inc. common stock.
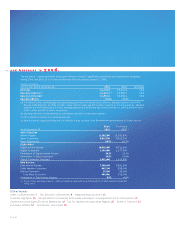
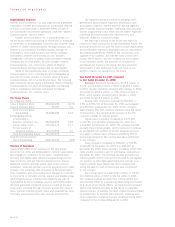
Pro Forma Shares
As of May 24, 2002:
Class A Common Stock 294,646,658 44.7%
Class B Common Stock 50,000 0.1
Total Common Stock
Outstanding 294,696,658 44.8
Exchangeable Equity
in Subsidiaries:
Charter Investment, Inc. 222,818,858 33.8
Vulcan Cable III Inc. 116,313,173 17.7
Former owners of
acquired systems 24,273,943 3.7
Total Exchangeable Equity 363,405,974
Total Pro Forma Common
Stock Outstanding 658,102,632 100%
Overview of Operations
Approximately 85% of our revenues for the year ended
December 31, 2001 are attributable to monthly subscription
fees charged to customers for our basic, expanded basic,
premium and digital cable television programming services,
Internet access through television-based service, dial-up
telephone modems and high-speed cable modem service,
equipment rental and ancillary services provided by our cable
systems. The remaining 15% of revenue is derived primarily
from installation and reconnection fees charged to customers
to commence or reinstate service, pay-per-view programming,
advertising revenues, commissions related to the sale of
merchandise by home shopping services and franchise fees.
We have generated increased revenues in each of the past
three years, primarily through customer growth from acquisi-
tions, internal customer growth, basic and expanded tier price
increases and revenues from new services and products.
Our expenses primarily consist of operating costs,
general and administrative expenses, depreciation and
amortization expense, interest expense and management
fees/corporate expense charges. Operating costs primarily
include programming costs, cable service related expenses,
marketing and advertising costs, franchise fees and
expenses related to customer billings.
We have had a history of net losses and expect to
continue to report net losses for the foreseeable future. The
principal reasons for our prior net losses include depreciation
and amortization expenses associated with our acquisitions
and capital expenditures related to the construction and
upgrade of our systems, and interest costs on borrowed
money. These factors, with the exception of amortization
of our franchise assets, are expected to contribute to
anticipated net losses in the future. We cannot predict
what impact, if any, continued losses will have on our
ability to finance our operations in the future.
Year Ended December 31, 2001 Compared
to Year Ended December 31, 2000
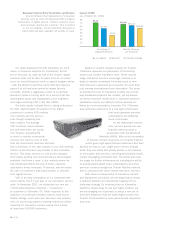
Revenues. Revenues increased by $703.9 million, or
21.7%, from $3,249.2 million in 2000 to $3,953.1 million
in 2001. System operations acquired after January 1, 2000
accounted for $524.6 million, or 75%, of the increase in
2001, while systems acquired before January 1, 2000
accounted for $179.3 million, or 25%.
Analog video customers increased by 602,800, or
9.5%, to 6,953,700 at December 31, 2001 as compared
to 6,350,900 at December 31, 2000. Of this increase,
approximately 581,700 customer additions were the result
of acquisitions. The remaining net increase of 21,100
customers relates to internal growth.
Digital video customers increased by 1,075,300,
or 100.5%, to 2,144,800 at December 31, 2001 from
1,069,500 at December 31, 2000. The increase resulted
primarily from internal growth, which continues to increase
as we upgrade our systems to provide advanced services
to a larger customer base. Increased marketing efforts
and strong demand for this service have also contributed
to the increase.
Data customers increased by 392,400, or 155.5%,
to 644,800 at December 31, 2001 from 252,400 at
December 31, 2000. Data customers consisted of 607,700
cable modem customers and 37,100 dial-up customers at
December 31, 2001. The increase resulted primarily from
internal growth, which continues to increase as we upgrade
our systems to offer high-speed interactive services to a
larger customer base. Marketing efforts coupled with
strong demand for such services have also contributed
to the increase.
Advertising sales increased $78.0 million, or 33.2%,
from $234.6 million in 2000 to $312.6 million in 2001.
The increase resulted primarily from internal growth and
was partially offset by a weakening advertising environment.
As a result of our rebuild efforts, we experienced increased
advertising capacity primarily as the result of expanded
channel line-ups. In addition, the level of advertising purchased
by programmers to promote their channels, added as part
of our expansion of channel line-ups, increased during 2001
compared to the corresponding period in 2000.
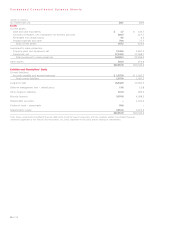
Financial Highlights