Charter 2001 Annual Report Download - page 8
Download and view the complete annual report
Please find page 8 of the 2001 Charter annual report below. You can navigate through the pages in the report by either clicking on the pages listed below, or by using the keyword search tool below to find specific information within the annual report.-
 1
1 -
 2
2 -
 3
3 -
 4
4 -
 5
5 -
 6
6 -
 7
7 -
 8
8 -
 9
9 -
 10
10 -
 11
11 -
 12
12 -
 13
13 -
 14
14 -
 15
15 -
 16
16 -
 17
17 -
 18
18 -
 19
19 -
20
-
21
-
22
-
23
-
24
-
25
-
26
-
27
-
28
 |
 |

6of 25
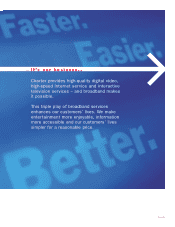
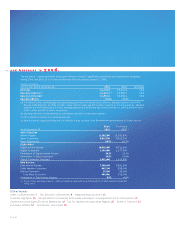
>> and business is good.
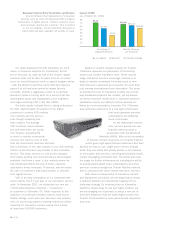
The pro forma(a) operating results below give effect to Charter’s significant acquisitions and dispositions completed
during 2000 and 2001 as if all such transactions had occurred on January 1, 2000.
(Dollars in millions)
For the Year Ended December 31, 2001 2000 % Change
Revenues $4,114.8 $3,610.8 14.0
Operating Expenses(b) $2,281.1(d) $1,956.7 16.6
Operating Cash Flow(c) $1,833.7 $1,654.1 10.9
Operating Margin 44.6% 45.8%
(a) Pro forma revenues, operating expenses and operating cash flow (OCF) exceed actual revenues, operating expenses and OCF for
the year ended December 31, 2001 by $161.7 million, $114.1 million and $47.6 million, respectively. Pro forma revenues, operating
expenses and OCF exceed actual revenues, operating expenses and OCF for the year ended December 31, 2000 by $361.6 million,
$250.1 million and $111.5 million, respectively.
(b) Operating expenses exclude depreciation, amortization and option compensation expense.
(c) OCF is defined as revenue less operating expenses.
(d) Before a special charge associated with the transition of data customers from Excite@Home Internet Service to Charter Pipeline.
Actual Pro Forma
As of December 31, 2001 2000 (e)
Cable Television
Homes Passed 11,502,300 11,291,800
Basic Customers 6,953,700 6,913,100
Basic Penetration 60.5% 61.2%
Digital Video
Digital Homes Passed 10,638,300 9,711,600
Digital Customers 2,144,800 1,177,500
Penetration of Digital Homes Passed 20.2% 12.1%
Penetration of Basic Customers 30.8% 17.0%
Digital Converters Deployed 2,951,400 1,470,500
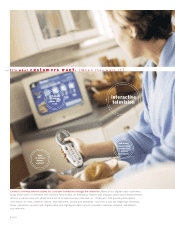
Data Services
Data Homes Passed 7,560,600 5,841,300
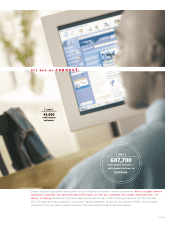
Cable Modem Customers 607,700 229,000
Dial-up Customers 37,100 42,000
Total Data Customers 644,800 271,000
Penetration of Data Homes Passed 8.5% 4.6%
(e) The pro forma operating statistics reflect all significant acquisitions and dispositions of cable systems completed
during 2001.
Table of Contents
Letter to Shareholders 7The Business of Broadband 9Organizational Structure 15
Financial Highlights 16 Responsibility for Financial Statements and Report of Independent Public Accountants 18
Condensed Consolidated Financial Statements 19 Top 20 Markets and Operating Regions 22 Board of Directors 23
Executive Officers 24 Shareholder Information 25