Cisco 2010 Annual Report Download - page 19
Download and view the complete annual report
Please find page 19 of the 2010 Cisco annual report below. You can navigate through the pages in the report by either clicking on the pages listed below, or by using the keyword search tool below to find specific information within the annual report.-
 1
1 -
2
-
3
-
4
-
5
-
6
-
7
-
8
-
 9
9 -
 10
10 -
 11
11 -
 12
12 -
 13
13 -
 14
14 -
 15
15 -
 16
16 -
 17
17 -
 18
18 -
 19
19 -
 20
20 -
 21
21 -
 22
22 -
 23
23 -
 24
24 -
 25
25 -
 26
26 -
 27
27 -
 28
28 -
 29
29 -
30
-
31
-
32
-
33
-
34
-
35
-
36
-
37
-
38
-
39
-
40
-
41
-
42
-
43
-
44
-
45
-
46
-
47
-
48
-
49
-
50
-
51
-
52
-
53
-
54
-
55
-
56
-
57
-
58
-
59
-
60
-
61
-
62
-
63
-
64
-
65
-
66
-
67
-
68
-
69
-
70
-
71
-
72
-
73
-
74
-
75
-
76
-
77
-
78
-
79
-
80
-
81
-
82
-
83
-
84
 |
 |

Management’s Discussion and Analysis of Financial Condition and Results of Operations
Discussion of Fiscal 2010, 2009, and 2008
Net Sales
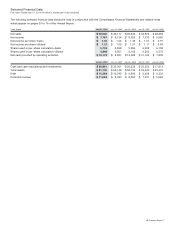
The following table presents the breakdown of net sales between product and service revenue (in millions, except percentages):
Years Ended July 31, 2010 July 25, 2009
Variance
in Dollars
Variance
in Percent July 25, 2009 July 26, 2008
Variance
in Dollars
Variance
in Percent
Net sales:
Product $ 32,420 $ 29,131 $ 3,289 11.3% $ 29,131 $ 33,099 $ (3,968) (12.0)%
Percentage of net sales 81.0% 80.7% 80.7% 83.7%
Service 7,620 6,986 634 9.1% 6,986 6,441 545 8.5 %
Percentage of net sales 19.0% 19.3% 19.3% 16.3%
Total $ 40,040 $ 36,117 $ 3,923 10.9% $ 36,117 $ 39,540 $(3,423) (8.7)%
We manage our business primarily on a geographic basis, organized into five geographic theaters. Our net sales, which include
product and service revenue, for each theater are summarized in the following table (in millions, except percentages):
Years Ended July 31, 2010 July 25, 2009
Variance
in Dollars
Variance
in Percent July 25, 2009 July 26, 2008
Variance
in Dollars
Variance
in Percent
Net sales:
United States and Canada $ 21,740 $ 19,345 $ 2,395 12.4% $ 19,345 $ 21,242 $ (1,897) (8.9)%
Percentage of net sales 54.3% 53.5% 53.5% 53.7%
European Markets 8,048 7,683 365 4.8% 7,683 8,123 (440) (5.4)%
Percentage of net sales 20.1% 21.3% 21.3% 20.5%
Emerging Markets 4,367 3,999 368 9.2% 3,999 4,530 (531) (11.7)%
Percentage of net sales 10.9% 11.1% 11.1% 11.5%
Asia Pacific 4,359 3,718 641 17.2% 3,718 4,276 (558) (13.0)%
Percentage of net sales 10.9% 10.3% 10.3% 10.8%
Japan 1,526 1,372 154 11.2% 1,372 1,369 3 0.2 %
Percentage of net sales 3.8% 3.8% 3.8% 3.5%
Total $ 40,040 $ 36,117 $ 3,923 10.9% $ 36,117 $ 39,540 $ (3,423) (8.7)%
Fiscal 2010 Compared with Fiscal 2009
Net sales increased across all of our geographic theaters in fiscal 2010 as compared with fiscal 2009. In our view, the sales
increase in fiscal 2010 was a result of the global demand recovery during fiscal 2010 in comparison to the weakness we
experienced for most of fiscal 2009. We had an increase in both net product sales and service revenue in fiscal 2010 compared
with fiscal 2009. From a customer market perspective, in fiscal 2010, we saw an improved demand environment for capital
expenditures and balanced growth across all of our customer markets.
We conduct business globally in numerous currencies. The direct effect of foreign currency fluctuations on sales has not been
material because our sales are primarily denominated in U.S. dollars. However, if the U.S. dollar strengthens relative to other
currencies, such strengthening could have an indirect effect on our sales to the extent it raises the cost of our products to non-U.S.
customers and thereby reduces demand. A weaker U.S. dollar could have the opposite effect. However, the precise indirect effect
of currency fluctuations is difficult to measure or predict because our sales are influenced by many factors in addition to the impact
of such currency fluctuations.
In addition to the impact of macroeconomic factors, net sales by theater in a particular period may be significantly impacted by
several factors related to revenue recognition, including the complexity of transactions such as multiple-element arrangements; the
mix of financing arrangements provided to our channel partners and customers; and final acceptance of the product, system, or
solution, among other factors. In addition, certain customers tend to make large and sporadic purchases and the net sales related
to these transactions may also be affected by the timing of revenue recognition, which in turn would impact the net sales of the
relevant theater.
Fiscal 2009 Compared with Fiscal 2008
We experienced a decline in our net product sales in fiscal 2009 compared with fiscal 2008, while our service revenue showed a
year-over-year increase. The global economic downturn and the effect it had on information technology spending resulted in
year-over-year decreases in product sales in our service provider, commercial, enterprise, and consumer markets and across all
our geographic theaters. However, within our enterprise market, the public sector showed relative strength across most of our
geographic theaters, compared with other customer markets within the respective theaters. Service revenue increased across all
theaters, led by higher sales in the Emerging Markets theater.
2010 Annual Report 17