Cisco 2010 Annual Report Download - page 57
Download and view the complete annual report
Please find page 57 of the 2010 Cisco annual report below. You can navigate through the pages in the report by either clicking on the pages listed below, or by using the keyword search tool below to find specific information within the annual report.-
 1
1 -
2
-
3
-
4
-
5
-
6
-
7
-
8
-
9
-
10
-
11
-
12
-
13
-
14
-
15
-
16
-
17
-
18
-
19
-
20
-
21
-
22
-
23
-
24
-
25
-
26
-
27
-
28
-
29
-
30
-
31
-
32
-
33
-
34
-
35
-
36
-
37
-
38
-
39
-
40
-
41
-
42
-
43
-
44
-
45
-
46
-
 47
47 -
 48
48 -
 49
49 -
 50
50 -
 51
51 -
 52
52 -
 53
53 -
 54
54 -
 55
55 -
 56
56 -
 57
57 -
 58
58 -
 59
59 -
 60
60 -
 61
61 -
 62
62 -
 63
63 -
 64
64 -
 65
65 -
 66
66 -
 67
67 -
68
-
69
-
70
-
71
-
72
-
73
-
74
-
75
-
76
-
77
-
78
-
79
-
80
-
81
-
82
-
83
-
84
 |
 |

Notes to Consolidated Financial Statements
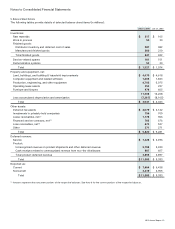
End-User Financing Guarantees The Company also provides financing guarantees for third-party financing arrangements extended
to end-user customers related to leases and loans that typically have terms of up to three years. The volume of financing provided
by third parties for leases and loans on which the Company has provided guarantees was $944 million for fiscal 2010 and $1.2
billion for both fiscal 2009 and fiscal 2008.
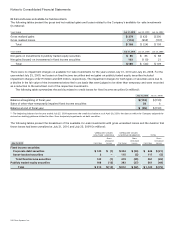
Financing Guarantee Summary The aggregate amount of financing guarantees outstanding at July 31, 2010 and July 25, 2009,
representing the total maximum potential future payments under financing arrangements with third parties, and the related deferred
revenue are summarized in the following table (in millions):
July 31, 2010 July 25, 2009
Maximum potential future payments relating to financing guarantees:
Channel partner $ 448 $ 334
End user 304 405
Total $ 752 $ 739
Deferred revenue associated with financing guarantees:
Channel partner $ 277 $ 218
End user 272 378
Total $ 549 $ 596
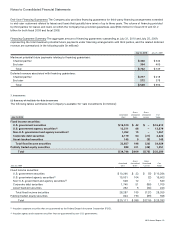
7. Investments
(a) Summary of Available-for-Sale Investments
The following tables summarize the Company’s available-for-sale investments (in millions):
Amortized
Cost
Gross
Unrealized
Gains
Gross
Unrealized
Losses
Fair
ValueJuly 31, 2010
Fixed income securities:
U.S. government securities $ 16,570 $ 42 $ — $ 16,612
U.S. government agency securities(1) 13,511 68 — 13,579
Non-U.S. government and agency securities(2) 1,452 15 — 1,467
Corporate debt securities 2,179 64 (21) 2,222
Asset-backed securities 145 9 (5) 149
Total fixed income securities 33,857 198 (26) 34,029
Publicly traded equity securities 889 411 (49) 1,251
Total $ 34,746 $ 609 $ (75) $ 35,280
Amortized
Cost
Gross
Unrealized
Gains
Gross
Unrealized
Losses
Fair
ValueJuly 25, 2009
Fixed income securities:
U.S. government securities $ 10,266 $ 23 $ (5) $ 10,284
U.S. government agency securities(1) 15,501 104 (2) 15,603
Non-U.S. government and agency securities(2) 528 12 — 540
Corporate debt securities 1,740 51 (86) 1,705
Asset-backed securities 252 5 (34) 223
Total fixed income securities 28,287 195 (127) 28,355
Publicly traded equity securities 824 193 (89) 928
Total $ 29,111 $ 388 $ (216) $ 29,283
(1) Includes corporate securities that are guaranteed by the Federal Deposit Insurance Corporation (FDIC).
(2) Includes agency and corporate securities that are guaranteed by non-U.S. governments.
2010 Annual Report 55