DTE Energy 2007 Annual Report Download - page 12
Download and view the complete annual report
Please find page 12 of the 2007 DTE Energy annual report below. You can navigate through the pages in the report by either clicking on the pages listed below, or by using the keyword search tool below to find specific information within the annual report.-
 1
1 -
 2
2 -
 3
3 -
 4
4 -
 5
5 -
 6
6 -
 7
7 -
 8
8 -
 9
9 -
 10
10 -
 11
11 -
 12
12 -
 13
13 -
 14
14 -
 15
15 -
 16
16 -
 17
17 -
 18
18 -
 19
19 -
 20
20 -
 21
21 -
 22
22 -
23
-
24
-
25
-
26
-
27
-
28
-
29
-
30
 |
 |

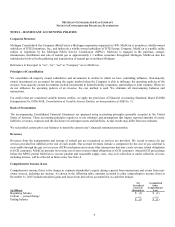
Cash Equivalents
Cash and cash equivalents include cash on hand, cash in banks and temporary investments purchased with remaining maturities of
three months or less.
Inventories
We value materials and supplies at average cost.
Gas inventory is determined using the last-in, first-out (LIFO) method. At December 31, 2007, the replacement cost of gas remaining
in storage exceeded the $32 million LIFO cost by $288 million. During 2007, MichCon liquidated 9.5 billion cubic feet of prior years’
LIFO layers. The liquidation reduced 2007 cost of gas by approximately $30 million, but had no impact on earnings as a result of the
GCR mechanism. At December 31, 2006, the replacement cost of gas remaining in storage exceeded the $77 million LIFO cost by
$236 million. During 2006, MichCon liquidated 5.1 billion cubic feet of prior years’ LIFO layers. The liquidation reduced 2006 cost
of gas by approximately $1 million, but had no impact on earnings as a result of the GCR mechanism.
Property, Retirement and Maintenance, and Depreciation and Depletion
Summary of property by classification as of December 31:
(in Millions) 2007 2006
Property, Plant and Equipment
Distribution $ 2,392 $ 2,175
Storage 273 245
Other 924 971
Total 3,589 3,391
Less Accumulated Depreciation
Distribution (970) (926)
Storage (100) (108)
Other (523) (505)
Total (1,593) (1,539)
Net Property, Plant and Equipment $ 1,996 $ 1,852
Property is stated at cost and includes construction-related labor, materials, overheads and an allowance for funds used during
construction (AFUDC). AFUDC capitalized during 2007 and 2006 was approximately $9 million and $4 million, respectively. The
cost of properties retired, less salvage value, is charged to accumulated depreciation. Expenditures for maintenance and repairs are
charged to expense when incurred.
We base depreciation provisions on straight-line and units-of-production rates approved by the MPSC. The composite depreciation
rate was 3.1 % in 2007, 2.8% in 2006, and 3.2% in 2005
The average estimated useful life for gas distribution and transmission property was 40 years and 37 years, respectively, at December
31, 2007.
Intangible assets relating to capitalized software are classified as Property, plant and equipment and the related amortization is
included in Accumulated depreciation on the Consolidated Statements of Financial Position. We capitalize the costs associated with
computer software we develop or obtain for use in our business. We amortize intangible assets on a straight-line basis over the
expected period of benefit, primarily 15 years. Intangible assets amortization expense was $6 million in each of the years 2007, 2006
and 2005. The gross carrying amount and accumulated amortization of intangible assets at December 31, 2007 were $90 million and
$43 million, respectively. The gross carrying amount and accumulated amortization of intangible assets at December 31, 2006 were
$105 million and $44 million, respectively. Amortization expense of intangible assets is estimated to be $6 million annually for 2008
through 2012.
10