DTE Energy 2009 Annual Report Download - page 4
Download and view the complete annual report
Please find page 4 of the 2009 DTE Energy annual report below. You can navigate through the pages in the report by either clicking on the pages listed below, or by using the keyword search tool below to find specific information within the annual report.-
 1
1 -
 2
2 -
 3
3 -
 4
4 -
 5
5 -
 6
6 -
 7
7 -
 8
8 -
 9
9 -
 10
10 -
 11
11 -
 12
12 -
 13
13 -
 14
14 -
 15
15 -
16
-
17
-
18
-
19
-
20
-
21
-
22
-
23
-
24
-
25
-
26
-
27
-
28
-
29
-
30
-
31
-
32
-
33
-
34
-
35
-
36
-
37
-
38
-
39
 |
 |

2
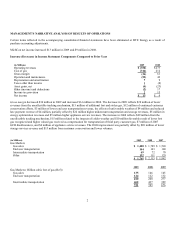
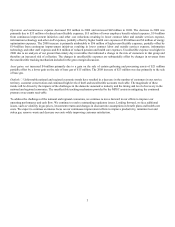
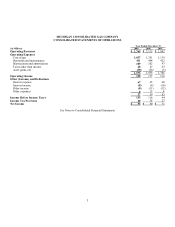
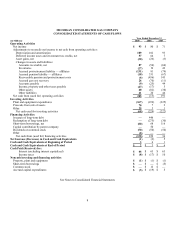
MANAGEMENT’S NARRATIVE ANALYSIS OF RESULTS OF OPERATIONS
Certain items reflected in the accompanying consolidated financial statements have been eliminated at DTE Energy as a result of
purchase accounting adjustments.
MichCon net income increased $13 million in 2009 and $9 million in 2008.
Increase (Decrease) in Income Statement Components Compared to Prior Year
(in Millions)
2009
2008
Operating revenues
$ (350)
$ 273
Cost of gas
(314)
212
Gross margin
(36)
61
Operation and maintenance
(53)
42
Depreciation and amortization
7
9
Taxes other than income
1
(8)
Asset gains, net
(4)
(23)
Other (income) and deductions
(2)
17
Income tax provision
2
15
Net income
$ 13
$ 9
Gross margin decreased $36 million in 2009 and increased $61 million in 2008. The decrease in 2009 reflects $28 million of lower
revenues from the uncollectible tracking mechanism, $15 million of additional lost and stolen gas, $12 million of continued customer
conservation efforts, $5 million of lower end user transportation revenue, the effects of unfavorable weather of $4 million and reduced
late payment revenue of $4 million, partially offset by $22 million higher midstream transportation and storage revenues, $5 million in
energy optimization revenues and $5 million higher appliance service revenues. The increase in 2008 reflects $49 million from the
uncollectible tracking mechanism, $15 million related to the impacts of colder weather and $10 million favorable result of lower lost
gas recognized and higher valued gas received as compensation for transportation of third party customer gas, $7 million of 2007
GCR disallowances, and $6 million of appliance service revenues. The 2008 improvement was partially offset by $20 million of lower
storage services revenue and $13 million from customer conservation and lower volumes.
(in Millions)
2009
2008
2007
Gas Markets
Gas sales
$ 1,420
$ 1,789
$ 1,503
End user transportation
144
143
140
Intermediate transportation
69
72
70
Other
132
111
129
$ 1,765
$ 2,115
$ 1,842
2009
2008
2007
Gas Markets ( Billion cubic feet of gas (Bcf))
Gas sales
135
146
145
End user transportation
124
122
132
259
268
277
Intermediate transportation
462
437
399
721
705
676