GE 2015 Annual Report Download - page 11
Download and view the complete annual report
Please find page 11 of the 2015 GE annual report below. You can navigate through the pages in the report by either clicking on the pages listed below, or by using the keyword search tool below to find specific information within the annual report.-
 1
1 -
 2
2 -
 3
3 -
 4
4 -
 5
5 -
 6
6 -
 7
7 -
 8
8 -
 9
9 -
 10
10 -
 11
11 -
 12
12 -
 13
13 -
 14
14 -
 15
15 -
 16
16 -
 17
17 -
 18
18 -
 19
19 -
 20
20 -
 21
21 -
 22
22 -
23
-
24
-
25
-
26
-
27
-
28
-
29
-
30
-
31
-
32
-
33
-
34
-
35
-
36
-
37
-
38
-
39
-
40
-
41
-
42
-
43
-
44
-
45
-
46
-
47
-
48
-
49
-
50
-
51
-
52
-
53
-
54
-
55
-
56
-
57
-
58
-
59
-
60
-
61
-
62
-
63
-
64
-
65
-
66
-
67
-
68
-
69
-
70
-
71
-
72
-
73
-
74
-
75
-
76
-
77
-
78
-
79
-
80
-
81
-
82
-
83
-
84
-
85
-
86
-
87
-
88
-
89
-
90
-
91
-
92
-
93
-
94
-
95
-
96
-
97
-
98
-
99
-
100
-
101
-
102
-
103
-
104
-
105
-
106
-
107
-
108
-
109
-
110
-
111
-
112
-
113
-
114
-
115
-
116
-
117
-
118
-
119
-
120
-
121
-
122
-
123
-
124
-
125
-
126
-
127
-
128
-
129
-
130
-
131
-
132
-
133
-
134
-
135
-
136
-
137
-
138
-
139
-
140
-
141
-
142
-
143
-
144
-
145
-
146
-
147
-
148
-
149
-
150
-
151
-
152
-
153
-
154
-
155
-
156
-
157
-
158
-
159
-
160
-
161
-
162
-
163
-
164
-
165
-
166
-
167
-
168
-
169
-
170
-
171
-
172
-
173
-
174
-
175
-
176
-
177
-
178
-
179
-
180
-
181
-
182
-
183
-
184
-
185
-
186
-
187
-
188
-
189
-
190
-
191
-
192
-
193
-
194
-
195
-
196
-
197
-
198
-
199
-
200
-
201
-
202
-
203
-
204
-
205
-
206
-
207
-
208
-
209
-
210
-
211
-
212
-
213
-
214
-
215
-
216
-
217
-
218
-
219
-
220
-
221
-
222
-
223
-
224
-
225
-
226
-
227
-
228
-
229
-
230
-
231
-
232
-
233
-
234
-
235
-
236
-
237
-
238
-
239
-
240
-
241
-
242
-
243
-
244
-
245
-
246
-
247
-
248
-
249
-
250
-
251
-
252
 |
 |

businesses, we are generating $35 billion of
cash, with $4.3 billion returned to the parent
in 2015 and another $18 billion in 2016. We
plan to use this cash to buy back shares.
Going forward, GE will retain a smaller fi-
nancial services capability connected to
our industrial core. This business should
promote industrial growth and generate re-
turns above our cost of capital. At this size,
we will apply to de-designate GE Capital as a
“systemically important financial institution,”
greatly reducing the regulatory risk in GE.
We completed the acquisition of Alstom that
we had begun in 2014. Alstom is a great
strategic and financial fit for GE. We plan to
generate $3 billion of cost synergy over five
years; Alstom will add $0.05 EPS in 2016 and
up to $0.20 by 2018. Alstom creates a more
global and technical GE. It adds significant
capability to our growth market footprint and
project management capability. It gives us
the potential for $5 billion of revenue through
replacing suppliers with internal capability
and by packaging complementary products
for our energy customers.
Alstom makes GE more competitive. In Saudi
Arabia, we recently won a 1.4 gigawatt order
based on efficiency gains derived through
combining a GE gas turbine with Alstom bal-
ance of plant. For this project, we were able to
lower system cost through the use of Alstom’s
project management capability. Alstom will
expand our presence in important markets
like India. Here, we have nearly doubled the
size of our revenue, our capability and mar-
ket potential. With Alstom, we become the
world’s largest renewable player. In Grid, the
combination of GE and Alstom makes us a
stronger competitor. We believe the Alstom
investment will generate a strong return.
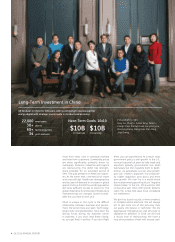
We announced the sale of our Appliances
business to Haier for $5.4 billion in the first
quarter of 2016. This is a great outcome for GE
investors and our team. The appliance market
is globalizing, with the China market growing
quickly. We think Haier is a long-term investor
in the U.S., a good home for the GE team. We
plan to work with Haier in China to build out
distribution and develop the GE brand. We will
redeploy this capital to higher returns.
We are seeing some good inorganic oppor-
tunities as economic volatility increases and
valuations decline. Acquisitions will bolt-on to
our existing businesses to make them more
competitive and increase their growth rate.
Unlike the financial crisis, in this cycle GE has
substantial firepower to make strategic in-
vestments that create value.
We don’t count on acquisitions to grow GE.
Rather, we are strong believers that we can
grow organically over the long term. We in-
vest more than $10 billion each year in R&D,
capital expenditures and systems. We have
a deep pipeline of new business platforms,
each of which can generate substantial reve-
nue over time. In Aviation, we are penetrating
one of our largest “untapped” segments in
turboprops. This has long been the domain
of our competitors. This began with a small
Czech acquisition in 2008. Over time, we lev-
eraged our technical strength to produce an
all-new engine design. This year we won the
biggest application on the Textron Advanced
Turboprop, set to certify in 2019. This will
lead to $40 billion in revenue over 25 years,
a long-lasting competitive win. GE Ventures is
a key catalyst for investing in mobile monitor-
ing and cell therapy, growth initiatives for our
Healthcare franchise. And we spun our LED
business into a new energy-efficiency plat-
form called Current. At $1 billion in revenue,
we are one of the biggest players in LED. By
packaging this with other energy-efficiency
technologies, controls and financing, we can
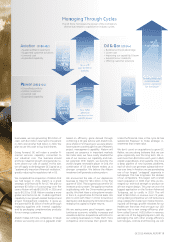
M
a
n
n
n
a
a
gin
g
g
g
T
h
r
o
o
ug
h
C
C
y
c
c
l
e
e
s
A
v
i
at
i
o
n
(
20
20
0
00
–0
0
0
2
)
+ Sustained R&D investmen
t
+ Supporte
d
customer so
l
ution
s
+ L
o
w
e
r
ed
cost
+ Expan
d
e
d
capa
b
i
l
it
y
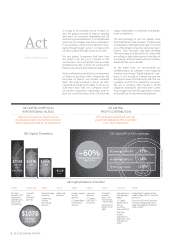
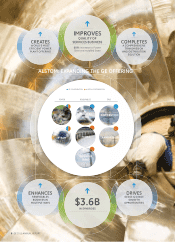
T
he GE Store harnesses the power of the Company’s
diverse businesses to capitalize on industr
y
c
y
cles
.
Engine
Shipments
~20%
P
P
P
P
P
o
o
we
r
r
(
20
0
01
1
–
0
4
)
+ D
iv
ve
rsi
fi
e
d
port
f
o
l
io
+ G
lo
ob
al
inv
est
men
t
+ L
ow
we
re
d
cos
t
+ E
xp
pa
nded capabil
ity
Gas
Turbine
Shipments
~65%
Now
Now
w
wi
h
h
w
w
wi
wi
th
th
No
Now
o
ove
r $
150B i
150B
e
r $
150B in
backlo
g
l
acklo
g
Oi
l
&
&
G
G
G
a
s
s
(
20
14
–
–
–)
+
Building technical advantag
e
+ L
owe
r c
ost
+
Improving our capability & tea
m
+
Expan
d
ing our capa
b
i
l
it
y
+
Offering customer solutio
ns
Oil Price
50%+
GE
Aspirations
To execute for our
c
customers and
pos
os
iti
iti
on
ves
iti
i
on
our
our
sel
sel
ves
ves
f
or t
h
e
f
utur
e
N
Now
h
he
l
lps
ow
he
ps
gen
er
ate
nera
te
one
-th
ird
f
th
e
d
of
t
w
or
ld
’s
p
ower
GE 2015 ANNUAL REPORT 9